[Typo: in the maps M529, also known as L21, is wrongly written as M259. My apologies]
This is one of the virtues of Myres' paper (that I mentioned yesterday): that a somewhat more clear phylogenetic subdivision is made, emphasizing the difference between West European R1b1b2a and other R1b or R1b1b2, often blurred in previous papers, causing great confusion even to researchers themselves.
This is one of the virtues of Myres' paper (that I mentioned yesterday): that a somewhat more clear phylogenetic subdivision is made, emphasizing the difference between West European R1b1b2a and other R1b or R1b1b2, often blurred in previous papers, causing great confusion even to researchers themselves.
A defect is that instead of using a standard name for the defining SNP (L51/S167 per ISOGG) they chose to name it M412. However Argiedude says it is the same marker and I imagine it is. [Update: confirmed: the rs number indicates it is the same SNP].
Another virtue is that some of the substructure of R1b1b2a1 is also mapped, what really covers pretty well the Northern and Italian area of spread of this lineage and even some relatively unmapped areas of SW Europe, specially France.
In any case the apparent structure is curious, so I got the supplementary table S4 (supp. material is freely accessible) and made this map:
 Click to enlarge
Notice that, following Argiedude, M412 stands for L51 and M529 stands for L21, what, if confirmed would make the following equivalences:
- R1b1b2a-M412 = R1b1b2a1 (L51)
- R1b1b2a1a2-M529 = R1b1b2a1a2f (L21)
Even if not confirmed, the equivalence should be approximate anyhow.
I'm sorry for the horrible color palette but it's my first attempt to make pie charts with Open Office spreadsheet gadget. Next time I'll do better I hope.
Notice also that I did not use all the samples, in the cases of small countries or less relevant regions I arbitrarily chose and discarded some.
Finally notice that pie charts represent only apportions of R1b1b2 and say nothing of the frequency of the lineage overall, which in most of East Europe and West Asia (excepting Turkey and a few neighbors) is extremely low.
The apparent structure of R1b1b2a1
The most apparent structure is, as we already knew the rather different R1b1b2a1a1 and R1b1b2a1a2 distribution. The first one (color coded brown and light blue) is dominant in the North and rather rare in the South - hence: 'North clade' for short hereafter. The second one (dark green, light green, purple and light orange) is by comparison not just more frequent in the South but also probably more diverse as well - hence: 'South clade'. However it is also found in the North.
Then there are some transitional "remnants": R1b1b2a1a* (L11) and R1b1b2a1* (M412). These should be informative (meaning some extra diversity at their structural levels) in order to infer the history of the haplogroup.
Per the hierarchical distribution seen here and diversity data from older works, the most likely origin of R1b1b2 as a whole is Anatolia.
Then R1b1b2a1* (M412) (yellow) is suggestive of a Mid-Danubian (or Italian or Iberian) coalescence.
R1b1b2a1a* (L11) (middle green) is suggestive of a West-Central European (or SW European) coalescence. More data on the Pyrenean region would clarify this maybe.
And, after this layer, comes the division into the widespread Southern and Northern clades mentioned before.
A reasonable interpretation is that the lineage traveled relatively fast upstream of the Danube (and/or via North Italy onto the SW), branching out then into the two major North/South clades. These two lower level lineages are in fact the two main stars of this demographic expansion.
My bet is that this represents a wave of colonization of Europe (when?) with secondary expansions from SW Europe (Franco-Cantabrian region possibly) and Central Europe (Rhine-Danube region I presume). There are several scenarios that can account for this, essentially Paleolithic (or pushing into the Epipaleolithic).
I don't see clearly how this structure could account for a Neolithic spread, really: no Mediterranean Neolithic pattern is apparent at all and Danubian limited expansion cannot account for any spread to SW Europe, certainly not South of the Loire and certainly not at the frequencies it is found there (nor in Britain/Ireland either). Claiming a Neolithic spread of R1b1b2 with this structure can only be done from a very shallow understanding of Neolithic archaeology and prehistory overall.
The main known demographic expansion we know of in the European Upper Paleolithic is the one after the Last Glacial Maximum, when Magdalenian culture expanded from the Franco-Cantabrian region, both northwards to Central Europe and, later, southwards into Iberia. This led to cultural divergence into the Epipaleolithic, with the important expansion into the newly available areas of the Far North, earlier covered in ice. Within the Epipaleolithic some further cultural flows are detected: from the Franco-Cantabrian region into Iberia (Azilian) and from somewhere in Mid-West Europe into the Southwest (Sauveterre-Tardenoisian).
Also, back to the LGM, Magdalenian techno-culture may have got a NW European ultimate inspirational origin but anyhow mediated by the warmer and richer Franco-Cantabrian region, where the culture flourished properly.
It's difficult to reconstruct in detail but, as far as I can tell, the two main North/South clades must have expanded in the Magdalenian period (one from the Franco-Cantabrian region, the other from Central-NW Europe itself) and also in the ulterior Epipaleolithic. Neolithic does not seem able to account for much but may have helped to shake the board a bit, specially in East-to-West direction.
Frequency maps
 Selected frequency maps from the paper
Click to enlarge
Notice that the expansion of the South clade to the Atlantic islands does not invalidate its southern character and probably represents an Epipaleolithic-to-Neolithic spread.
Notice also the large amount of unclassified Southern clade in Iberia. The area around the Pyrenees was not really sampled in this study and therefore it is distorted by neighbors ("South France", looking more like SE France, Valencia and Cantabria).
In order to appreciate better the real thing in this aspect it's probably good to take a look at Cruciani 2010, who did bother to sample near the Pyrenees and gets maybe better (or at least complementary) maps illustrating the same problem.
Update: I superimposed (with complementary colors) the South (red) and North (blue) clades from the frequency maps above. However in order to account for the differences of frequency, I had to lighten the blue shade (North clade) because the scales are different. Take it as an "artist's impression" anyhow:

Update (Aug 27):
Here there is a hopefully better version of the map at the beginning of this post:
 Click to enlarge
I put special care in giving each distinct clade an specific color range for easier visualization. All R1b1b2a1 (M412/L51/S167) seems to have coalesced in the Central-to-Western European area but the real expansion seems to have happened after this haplogroup split in two, which I dubbed the North and South clades.
And this is my reconstruction of the haplogroup expansion:
 Click to enlarge
Color coded as above
Update (Aug 28):
Take a peek at the comment section, where I briefly discuss molecular clock difficulties and also the only possible Neolithic scenario for R1b1b2a1a2 (South clade): a massive demographic expansion in the context of Megalithism.
Rejecting or confirming this would require greater research in the structure hidden "under the asterisk" in SW Europe. At the moment only two minimally-sized sub-haplogroups are known: Basque/Gascon-specific R1b1b2a1a2b and sub-Pyrenean R1b1b2a1a2c (Gascon, Catalan, etc.). This alone gives highest structural diversity to the Pyrenean region, however most of the South clade remains unresolved (hidden under the asterisk), both in the Pyrenean area as in Iberia proper. And the key issue to solve would be if R1b1b2a1a2 is most diverse at the Pyrenees, what favors a Paleolithic spread scenario, or in West Iberia (and Brittany/West France), what would favor a Neolithic-Megalithic spread scenario instead.
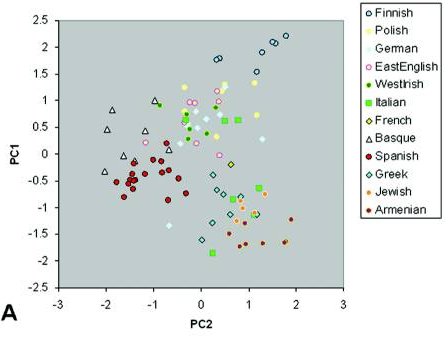
Also it's maybe important to remind here the excellent STR work of Laura Morelli earlier this year, which was discussed in this article.
Importantly, this graph (annotated by me):

The graph is suggestive of the existence of another "West Asian" distinct haplogroup "under the asterisk" (that I labeled "R1b1b2a2?") and a possible Balcanic, rather than Anatolian origin for the R1b1b2 clade.
If so, this would correlate with the high diversity of the (much smaller) brother haplogroup R1b1a in the Italy-West Asia arch (as well as in Central Africa) and would suggest a slightly different origin and scatter for R1b as a whole (ref 1, ref 2).
I'm sorry for the horrible color palette but it's my first attempt to make pie charts with Open Office spreadsheet gadget. Next time I'll do better I hope.
Notice also that I did not use all the samples, in the cases of small countries or less relevant regions I arbitrarily chose and discarded some.
Finally notice that pie charts represent only apportions of R1b1b2 and say nothing of the frequency of the lineage overall, which in most of East Europe and West Asia (excepting Turkey and a few neighbors) is extremely low.
The apparent structure of R1b1b2a1
The most apparent structure is, as we already knew the rather different R1b1b2a1a1 and R1b1b2a1a2 distribution. The first one (color coded brown and light blue) is dominant in the North and rather rare in the South - hence: 'North clade' for short hereafter. The second one (dark green, light green, purple and light orange) is by comparison not just more frequent in the South but also probably more diverse as well - hence: 'South clade'. However it is also found in the North.
Then there are some transitional "remnants": R1b1b2a1a* (L11) and R1b1b2a1* (M412). These should be informative (meaning some extra diversity at their structural levels) in order to infer the history of the haplogroup.
Per the hierarchical distribution seen here and diversity data from older works, the most likely origin of R1b1b2 as a whole is Anatolia.
Then R1b1b2a1* (M412) (yellow) is suggestive of a Mid-Danubian (or Italian or Iberian) coalescence.
R1b1b2a1a* (L11) (middle green) is suggestive of a West-Central European (or SW European) coalescence. More data on the Pyrenean region would clarify this maybe.
And, after this layer, comes the division into the widespread Southern and Northern clades mentioned before.
A reasonable interpretation is that the lineage traveled relatively fast upstream of the Danube (and/or via North Italy onto the SW), branching out then into the two major North/South clades. These two lower level lineages are in fact the two main stars of this demographic expansion.
My bet is that this represents a wave of colonization of Europe (when?) with secondary expansions from SW Europe (Franco-Cantabrian region possibly) and Central Europe (Rhine-Danube region I presume). There are several scenarios that can account for this, essentially Paleolithic (or pushing into the Epipaleolithic).
I don't see clearly how this structure could account for a Neolithic spread, really: no Mediterranean Neolithic pattern is apparent at all and Danubian limited expansion cannot account for any spread to SW Europe, certainly not South of the Loire and certainly not at the frequencies it is found there (nor in Britain/Ireland either). Claiming a Neolithic spread of R1b1b2 with this structure can only be done from a very shallow understanding of Neolithic archaeology and prehistory overall.
The main known demographic expansion we know of in the European Upper Paleolithic is the one after the Last Glacial Maximum, when Magdalenian culture expanded from the Franco-Cantabrian region, both northwards to Central Europe and, later, southwards into Iberia. This led to cultural divergence into the Epipaleolithic, with the important expansion into the newly available areas of the Far North, earlier covered in ice. Within the Epipaleolithic some further cultural flows are detected: from the Franco-Cantabrian region into Iberia (Azilian) and from somewhere in Mid-West Europe into the Southwest (Sauveterre-Tardenoisian).
Also, back to the LGM, Magdalenian techno-culture may have got a NW European ultimate inspirational origin but anyhow mediated by the warmer and richer Franco-Cantabrian region, where the culture flourished properly.
It's difficult to reconstruct in detail but, as far as I can tell, the two main North/South clades must have expanded in the Magdalenian period (one from the Franco-Cantabrian region, the other from Central-NW Europe itself) and also in the ulterior Epipaleolithic. Neolithic does not seem able to account for much but may have helped to shake the board a bit, specially in East-to-West direction.
Frequency maps
 Selected frequency maps from the paper
Click to enlarge
Notice that the expansion of the South clade to the Atlantic islands does not invalidate its southern character and probably represents an Epipaleolithic-to-Neolithic spread.
Notice also the large amount of unclassified Southern clade in Iberia. The area around the Pyrenees was not really sampled in this study and therefore it is distorted by neighbors ("South France", looking more like SE France, Valencia and Cantabria).
In order to appreciate better the real thing in this aspect it's probably good to take a look at Cruciani 2010, who did bother to sample near the Pyrenees and gets maybe better (or at least complementary) maps illustrating the same problem.
Update: I superimposed (with complementary colors) the South (red) and North (blue) clades from the frequency maps above. However in order to account for the differences of frequency, I had to lighten the blue shade (North clade) because the scales are different. Take it as an "artist's impression" anyhow:

Update (Aug 27):
Here there is a hopefully better version of the map at the beginning of this post:
 Click to enlarge
I put special care in giving each distinct clade an specific color range for easier visualization. All R1b1b2a1 (M412/L51/S167) seems to have coalesced in the Central-to-Western European area but the real expansion seems to have happened after this haplogroup split in two, which I dubbed the North and South clades.
And this is my reconstruction of the haplogroup expansion:
 Click to enlarge
Color coded as above
Update (Aug 28):
Take a peek at the comment section, where I briefly discuss molecular clock difficulties and also the only possible Neolithic scenario for R1b1b2a1a2 (South clade): a massive demographic expansion in the context of Megalithism.
Rejecting or confirming this would require greater research in the structure hidden "under the asterisk" in SW Europe. At the moment only two minimally-sized sub-haplogroups are known: Basque/Gascon-specific R1b1b2a1a2b and sub-Pyrenean R1b1b2a1a2c (Gascon, Catalan, etc.). This alone gives highest structural diversity to the Pyrenean region, however most of the South clade remains unresolved (hidden under the asterisk), both in the Pyrenean area as in Iberia proper. And the key issue to solve would be if R1b1b2a1a2 is most diverse at the Pyrenees, what favors a Paleolithic spread scenario, or in West Iberia (and Brittany/West France), what would favor a Neolithic-Megalithic spread scenario instead.
Also it's maybe important to remind here the excellent STR work of Laura Morelli earlier this year, which was discussed in this article.
Importantly, this graph (annotated by me):
The graph is suggestive of the existence of another "West Asian" distinct haplogroup "under the asterisk" (that I labeled "R1b1b2a2?") and a possible Balcanic, rather than Anatolian origin for the R1b1b2 clade.
If so, this would correlate with the high diversity of the (much smaller) brother haplogroup R1b1a in the Italy-West Asia arch (as well as in Central Africa) and would suggest a slightly different origin and scatter for R1b as a whole (ref 1, ref 2).