New blogs

Leherensuge was replaced in October 2010 by two new blogs: For what they were... we are and For what we are... they will be. Check them out.
Showing posts with label population genetics. Show all posts

Thursday, August 26, 2010

R1b1b2a1 is almost unique of West Europe

[Typo: in the maps M529, also known as L21, is wrongly written as M259. My apologies]

This is one of the virtues of Myres' paper (that I mentioned yesterday): that a somewhat more clear phylogenetic subdivision is made, emphasizing the difference between West European R1b1b2a and other R1b or R1b1b2, often blurred in previous papers, causing great confusion even to researchers themselves.

A defect is that instead of using a standard name for the defining SNP (L51/S167 per ISOGG) they chose to name it M412. However Argiedude says it is the same marker and I imagine it is. [Update: confirmed: the rs number indicates it is the same SNP].

Another virtue is that some of the substructure of R1b1b2a1 is also mapped, what really covers pretty well the Northern and Italian area of spread of this lineage and even some relatively unmapped areas of SW Europe, specially France.

In any case the apparent structure is curious, so I got the supplementary table S4 (supp. material is freely accessible) and made this map:

Click to enlarge

Notice that, following Argiedude, M412 stands for L51 and M529 stands for L21, what, if confirmed would make the following equivalences:
  • R1b1b2a-M412 = R1b1b2a1 (L51)
  • R1b1b2a1a2-M529 = R1b1b2a1a2f (L21)
Even if not confirmed, the equivalence should be approximate anyhow.

I'm sorry for the horrible color palette but it's my first attempt to make pie charts with Open Office spreadsheet gadget. Next time I'll do better I hope.

Notice also that I did not use all the samples, in the cases of small countries or less relevant regions I arbitrarily chose and discarded some.

Finally notice that pie charts represent only apportions of R1b1b2 and say nothing of the frequency of the lineage overall, which in most of East Europe and West Asia (excepting Turkey and a few neighbors) is extremely low.

The apparent structure of R1b1b2a1

The most apparent structure is, as we already knew the rather different R1b1b2a1a1 and R1b1b2a1a2 distribution. The first one (color coded brown and light blue) is dominant in the North and rather rare in the South - hence: 'North clade' for short hereafter. The second one (dark green, light green, purple and light orange) is by comparison not just more frequent in the South but also probably more diverse as well - hence: 'South clade'. However it is also found in the North.

Then there are some transitional "remnants": R1b1b2a1a* (L11) and R1b1b2a1* (M412). These should be informative (meaning some extra diversity at their structural levels) in order to infer the history of the haplogroup.

Per the hierarchical distribution seen here and diversity data from older works, the most likely origin of R1b1b2 as a whole is Anatolia.

Then R1b1b2a1* (M412) (yellow) is suggestive of a Mid-Danubian (or Italian or Iberian) coalescence.

R1b1b2a1a* (L11) (middle green) is suggestive of a West-Central European (or SW European) coalescence. More data on the Pyrenean region would clarify this maybe.

And, after this layer, comes the division into the widespread Southern and Northern clades mentioned before.

A reasonable interpretation is that the lineage traveled relatively fast upstream of the Danube (and/or via North Italy onto the SW), branching out then into the two major North/South clades. These two lower level lineages are in fact the two main stars of this demographic expansion.

My bet is that this represents a wave of colonization of Europe (when?) with secondary expansions from SW Europe (Franco-Cantabrian region possibly) and Central Europe (Rhine-Danube region I presume). There are several scenarios that can account for this, essentially Paleolithic (or pushing into the Epipaleolithic).

I don't see clearly how this structure could account for a Neolithic spread, really: no Mediterranean Neolithic pattern is apparent at all and Danubian limited expansion cannot account for any spread to SW Europe, certainly not South of the Loire and certainly not at the frequencies it is found there (nor in Britain/Ireland either). Claiming a Neolithic spread of R1b1b2 with this structure can only be done from a very shallow understanding of Neolithic archaeology and prehistory overall.

The main known demographic expansion we know of in the European Upper Paleolithic is the one after the Last Glacial Maximum, when Magdalenian culture expanded from the Franco-Cantabrian region, both northwards to Central Europe and, later, southwards into Iberia. This led to cultural divergence into the Epipaleolithic, with the important expansion into the newly available areas of the Far North, earlier covered in ice. Within the Epipaleolithic some further cultural flows are detected: from the Franco-Cantabrian region into Iberia (Azilian) and from somewhere in Mid-West Europe into the Southwest (Sauveterre-Tardenoisian).

Also, back to the LGM, Magdalenian techno-culture may have got a NW European ultimate inspirational origin but anyhow mediated by the warmer and richer Franco-Cantabrian region, where the culture flourished properly.

It's difficult to reconstruct in detail but, as far as I can tell, the two main North/South clades must have expanded in the Magdalenian period (one from the Franco-Cantabrian region, the other from Central-NW Europe itself) and also in the ulterior Epipaleolithic. Neolithic does not seem able to account for much but may have helped to shake the board a bit, specially in East-to-West direction.


Frequency maps

Selected frequency maps from the paper
Click to enlarge

Notice that the expansion of the South clade to the Atlantic islands does not invalidate its southern character and probably represents an Epipaleolithic-to-Neolithic spread.

Notice also the large amount of unclassified Southern clade in Iberia. The area around the Pyrenees was not really sampled in this study and therefore it is distorted by neighbors ("South France", looking more like SE France, Valencia and Cantabria).

In order to appreciate better the real thing in this aspect it's probably good to take a look at Cruciani 2010, who did bother to sample near the Pyrenees and gets maybe better (or at least complementary) maps illustrating the same problem.


Update: I superimposed (with complementary colors) the South (red) and North (blue) clades from the frequency maps above. However in order to account for the differences of frequency, I had to lighten the blue shade (North clade) because the scales are different. Take it as an "artist's impression" anyhow:


Update (Aug 27):

Here there is a hopefully better version of the map at the beginning of this post:

Click to enlarge

I put special care in giving each distinct clade an specific color range for easier visualization. All R1b1b2a1 (M412/L51/S167) seems to have coalesced in the Central-to-Western European area but the real expansion seems to have happened after this haplogroup split in two, which I dubbed the North and South clades.

And this is my reconstruction of the haplogroup expansion:

Click to enlarge
Color coded as above


Update (Aug 28):

Take a peek at the comment section, where I briefly discuss molecular clock difficulties and also the only possible Neolithic scenario for R1b1b2a1a2 (South clade): a massive demographic expansion in the context of Megalithism.

Rejecting or confirming this would require greater research in the structure hidden "under the asterisk" in SW Europe. At the moment only two minimally-sized sub-haplogroups are known: Basque/Gascon-specific R1b1b2a1a2b and sub-Pyrenean R1b1b2a1a2c (Gascon, Catalan, etc.). This alone gives highest structural diversity to the Pyrenean region, however most of the South clade remains unresolved (hidden under the asterisk), both in the Pyrenean area as in Iberia proper. And the key issue to solve would be if R1b1b2a1a2 is most diverse at the Pyrenees, what favors a Paleolithic spread scenario, or in West Iberia (and Brittany/West France), what would favor a Neolithic-Megalithic spread scenario instead.

Also it's maybe important to remind here the excellent STR work of Laura Morelli earlier this year, which was discussed in this article.

Importantly, this graph (annotated by me):


The graph is suggestive of the existence of another "West Asian" distinct haplogroup "under the asterisk" (that I labeled "R1b1b2a2?") and a possible Balcanic, rather than Anatolian origin for the R1b1b2 clade.

If so, this would correlate with the high diversity of the (much smaller) brother haplogroup R1b1a in the Italy-West Asia arch (as well as in Central Africa) and would suggest a slightly different origin and scatter for R1b as a whole (ref 1, ref 2).

Wednesday, August 4, 2010

Genetic flow across the Strait of Gibraltar


Researchers from the University of Geneva try to address the somewhat complex problem of genetic flow across the Strait of Gibraltar, between SW Europe and NW Africa, in a new paper:


Mathias Currat et al., Human genetic differentiation across the Strait of Gibraltar. BMC Evolutionary Biology, 2010. Open access.

They analyze a number of genetic variables such as Y-DNA, mtDNA, blood groups ABO and Rh, and other antigen/antibody systems (HLA, MNS and GM) and produce a number of statistical analysis for them. However they acknowledge that their modeling on continuous, rather than punctual, gene flow, may have some difficulties providing clear-cut answers.

Still they do produce results that are in general favorable for the P scenario (flow since 20,000 years ago), excepting to some extent the Y-DNA, which is probably a secondary sex-biased element overall.

Above: The scenarios are described in page 10 and in the supplementary material. P is "Paleolithic" flow beginning 20,000 years ago (Ibero-Maurusian or Oranian culture) among small populations, N instead is "Neolithic" flow among larger populations. PN is intermediate and PNI is intermediate but also considering the Islamic expansion (though details are not provided).

They also produce results of quite greater affinity within each region (SW Europe and NW Africa) than between them, as expected.


Notice in this graph (and also fig. 3) how autosomal markers' curves and that of mtDNA (MT-HV1, in blue) are very similar, however while mtDNA tends to lesser homogeneity within regions, it strongly tends to higher homogeneity instead across the Strait. This I interpret as meaning greater affinity across the strait in the Paleolithic, before the primarily male expansions reflected in the Y-DNA, altered the scenario.

Sadly no graphs for each of the two regions is provided, what does not allow us to make a more detailed assessment, like whether the Y-DNA expansion happened at both coasts or not, and, if so, if they were fully comparable or somehow different. I say this because the apparent SW European origin of North African mtDNA H (c. 25%) detected by Cherni 2008, and probably other haplogroups like V and K, would be consistent with a more European-like population before the E1b1b1 expansion in the context of Capsian culture (in North Africa) which is probably associated also to the expansion of Afroasiatic languages. However I see no reason to support a similar male-biased expansion in SW Europe.

Let the authors conclude:

Conclusion

While contrasted conclusions were obtained by previous studies based mostly on single genetic loci, our study clarifies the role of the Strait of Gibraltar regarding its permeability to gene flow. Indeed, our multi-locus approach led us to take into account variations between loci when trying to infer past history of human populations around the Gibraltar area. We were thus able to show that the Y chromosome on one side, and HLA-DRB1 on the other side constitute two extreme cases of very strong and very weak (respectively) genetic differentiations between populations across the Strait. The lack of genetic differentiation for HLA-DRB1 is particularly interesting because it can be explained by balancing selection (with a coefficient of selection estimated here to be around 2%). Given the huge worldwide dataset available for this locus, a better understanding on the mechanisms of selection at HLA loci could be very helpful to the study of human evolution, and more generally MHC. Our results obtained for Gibraltar have to be confirmed by further studies in other areas, especially where gene flow between populations is reduced. This work thus constitutes a step forward towards a better characterization of the combined effects of selection and demography on the genetic structure of populations, and especially on their genetic differentiation.

Saturday, July 31, 2010

Korean genetics: between China and Japan with some unique personality


New paper on Korean genetics:


Jonshung Jung, Hoyoung Kang et al. Gene Flow between the Korean Peninsula and Its Neighboring Countries. PLoS ONE 2010. Open access.

The most relevant results are probably in these graphs that follow:

Figure 3: Genetic Structure

Legend and details for the various samples can be seen in figure 2. Notice please that CB (Cambodian) is mistakenly placed in Northern Asia, when it should be in Southern Asia (i.e. SE Asia) along with Vietnamese (VN) and Vietnamese-Koreans (VC probably though elsewhere tagged as VK).

Notice also that there are two K=5 in the global cluster analysis (C), one of them marked as RH, what means "recombination hotspot", which is a technical albeit interesting matter they deal with in extent in the supplementary materials. The conclusion seems to be that these recombination hotspots can induce distortions in the cluster analysis and that should be dealt with in order to prevent confusing results.

Anyhow the most valid run for the global dataset is surely K=4, showing four neatly distinct clusters: Africans, Europeans (or West Eurasians), Amerindians and East Asians. The minor "admixture" apparent levels among Amerindians and some East Asians (Mongolians, Cambodians) may or not mean admixture. In my opinion, based on comparison with other different studies, I think it does not but rather indicates a lesser degree of affinity with the main cluster and therefore some small degree of affinity with other Eurasians. Careful sampling strategies, such as the one done by Hui Li last year may be needed to discern what exactly means, if anything at all.

Most probably the "European affinity" apparent in these two cases just means some Central Eurasian (or Siberian) affinity of Mongols, as shown in Hui Li's paper, as well as in Amerindians, and some South Asian affinity of Cambodians as detected for neighboring Thais in the recent paper by Jinchuang Xing.

When comparing East Asians alone (B), three clusters are apparent (K=3): a "Mongolian" one (blue), a SE Asian one (green), more intense in Cambodians than Vietnamese, and the middle East Asian one including Chinese, Korean and Japanese (and largely Vietnamese too). K=4 seems to indicate a diffuse (low level) Japanese-Korean affinity but this is better seen in the middle East Asian comparison.

In panel A (with only Chinese, Koreans and Japanese), we can see three clusters again (K=3): Chinese (green), Japanese (red) and Korean (blue). However most Koreans are not clearly differentiated from their neighbors, specially Chinese, and only the insular population of Jeju shows a much stronger Korean-specific homogeneity (though still with some Japanese influence).

Figure 4: MDS and NJ Tree of Korean, Chinese and Japanese


MDS stands for multidimensional scaling, a way of visually presenting statistical data in two or more dimensions, somewhat similar to PCA. NJ stands for neighbor-joining, a method used to build affinity trees in genetics that you are probably familiar with.

According to the legend, in the MDS plot (A) the 1st (horizontal) dimension includes 90% of the variance, while the 2nd (vertical) dimension only 1%! It could perfectly be a linear plot with most East Asians clustering to the left and a small odd group to the right. This "odd group" is mostly made of SE Koreans, plus three Japanese Koreans (from Kobe) and one Kobe Japanese.

However this must be an error of the legend and the vertical axis is without doubt the 1st dimension. Notice the scale, which is of 1/1000 order of magnitude in the horizontal axis and only 1/10 in the vertical one. Notice also how a China-Korea-Japan, with some eccentricity for Korea, is fully consistent with all other data provided.

The NJ tree indicates an apparent first divergence in three branches:

1. A Japanese-only branch (most Japanese fall here)
2. A mostly Korean branch, including also one Japanese and three Chinese
3. The major branch including most Koreans and Chinese, as well as two Japanese. This one, in turn splits in:

3a. Including the two remnant Japanese and all the rest being Koreans.
3b. A large branch including only Koreans and Chinese. It divides in two:

3b1. Almost only Koreans (only one Chinese here I think), with high incidence of SW Koreans.
3b2. Many Koreans too (with high incidence of SE Koreans) plus most Chinese, concentrated in a particular sub-branch (bottom of graph).

Caution must be placed to Korean-centric readings in any case because Koreans are clearly oversampled, what is surely distorting the tree structure to at least some extent. However if this structure could find confirmation in further more balanced studies, it might well support a colonization process along the coast, which is pretty much mainstream these days.

Koreans anyhow mostly cluster with Chinese here too, which is consistent with the STRUCTURE analysis, showing some SW-SE (West-East?) internal polarity in the peninsula.

Notice that no sampling was undertaken, without doubt because of the political circumstances, in the northern half of the peninsula. Notice also that both Chinese samples are from the North (Beijing and Manchuria).

Thursday, July 22, 2010

New paper on human autosomal phylogenetics


A reader points me to a new quite interesting paper on human phylogeny from the viewpoint of autosomal DNA mainly.

Jinchuang Xing et al. Toward a more uniform sampling of human genetic diversity: A survey of worldwide populations by high-density genotyping. Genomics 2010. Pay per view.

A copy can be found at ZohoViewer and the supplementary material is also freely available.

Abstract

High-throughput genotyping data are useful for making inferences about human evolutionary history. However, the populations sampled to date are unevenly distributed, and some areas (e.g., South and Central Asia) have rarely been sampled in large-scale studies. To assess human genetic variation more evenly, we sampled 296 individuals from 13 worldwide populations that are not covered by previous studies. By combining these samples with a data set from our laboratory and the HapMap II samples, we assembled a final dataset of ~ 250,000 SNPs in 850 individuals from 40 populations. With more uniform sampling, the estimate of global genetic differentiation (FST) substantially decreases from ~ 16% with the HapMap II samples to ~ 11%. A panel of copy number variations typed in the same populations shows patterns of diversity similar to the SNP data, with highest diversity in African populations. This unique sample collection also permits new inferences about human evolutionary history. The comparison of haplotype variation among populations supports a single out-of-Africa migration event and suggests that the founding population of Eurasia may have been relatively large but isolated from Africans for a period of time. We also found a substantial affinity between populations from central Asia (Kyrgyzstani and Mongolian Buryat) and America, suggesting a central Asian contribution to New World founder populations.


Fig. 3 click to expand

The abstract already addresses which are the most important conclusions of the paper: (1) lower genetic distances with better sampling strategies, (2) claim of large distinct founder population at the origins of the Out of Africa migration and (3) claim of greater affinity of Native Americans with Central Asians than with East Asians senso stricto. Additionally they also emphasize (4) the finding that the West Eurasian component in South Asians is of West Asian origin rather than European.

In the graphs I have noticed a couple of other details worth of mention: (5) that Pygmies appear more distinct than Khoisan from the bulk of the species (which is somewhat contradictory with the haploid phylogeny) and (6) that the closest African populations to Eurasians are "Nilotic" groups of the Kenya-Uganda-Ituri area (neither the Horn of Africa nor the Nile Basin were sampled).

I will address some of these matters now.


The migrant Out of Africa population

The authors take some time to address the issue of the migrant population in pages 20-21:

The OoA hypothesis, proposing a single OoA bottleneck followed by an expansion into Eurasia approximately 50,000 years ago, has gained extensive support from the archaeological record and genetic studies. Nevertheless, many of the historical details of this diaspora remain unclear. A common interpretation is that the OoA bottleneck was the result of a migration of a small founding population into Eurasia. Given the difference in haplotype heterozygosity between African and non-African populations and the relationship between heterozygosity and effective population size, we can estimate the effective population size of such a founding population . Within Africa, the average 100-kb haplotype heterozygosity in our data is 0.91. Immediately outside of Africa in Europe, the Middle East, and Central Asia, the average haplotype heterozygosity is 0.82 (Figure 2). A reduction of heterozygosity from 0.91 to 0.82 in a one-generation bottleneck would require an effective population size of only 5.5 individuals. While a one-generation bottleneck is an oversimplification, these estimates indicate that an OoA bottleneck resulting from the migration of a small founding population would require an extremely small population size. However, given that the archaeological record indicates a rapid expansion of modern humans into Europe and Asia in just a few thousand years , it seems unlikely that Eurasia could be populated so quickly by a such a small founding population.

A more likely explanation for the OoA bottleneck is that Eurasia was populated by a larger population that had been relatively isolated from other modern human populations for tens of thousands of years prior to the expansion. The first fossil evidence for modern humans outside of Africa is in the Middle East at Skhul and Qafzeh between 80,000-100,000 years ago, which is at least 20,000 years prior to the Eurasian diaspora. If a population of modern humans remained in the Middle East until the expansion into Eurasia, there would have been sufficient time for genetic drift to reduce heterozygosity dramatically before the Eurasia expansion. This “Middle East isolation” hypothesis provides a robust explanation for the relative homogeneity of European and Asian populations relative to African populations (see Figures 3A-B) and is supported by a recent maximum likelihood estimate of 140,000 years ago for the time of Eurasian-West African population separation. Interestingly, a recent study of the Neandertal genome suggests that the non-African individuals, but not the Africans, contain similar amount of admixture (1-4%) with the Neandertals. The authors suggest that the admixture must have happened between the Neandertals with an ancestral non-African population before the Eurasian expansion. Given the fossil, archaeological, and genetic evidence, the Middle East isolation hypothesis warrants rigorous evaluation as whole-genome sequence data become available.

I must say that the real problem is to be talking of a mere depth of 50,000 years for H. sapiens colonization of Eurasia, when that must be the date of the reflux into West Eurasia. The archaeological record for Asia east of Iran is inconclusive (too poor) and the genetic data, including the one available here, strongly suggests that South and East Asia were colonized before West Eurasia.

Hence we must be talking of a quite greater time depth such as the 75-80,000 years ago or more, as has been suggested by most population genetic analysis as of late. Certainly nothing less than 60,000 years ago minimum.

The assumption the authors make is therefore wrong so it's likely that the conclusion is also wrong.

That doesn't mean that the considerations they make, specially those regarding a very small colonizer population do not make sense. This small group of adventurous colonists could perfectly have colonized Asia with much more time, leaving very few remains precisely because they were few and even when they grew up in numbers they were still not many. The relatively poor situation of Asian archaeology does not help to unravel the case in either direction but we must remember that the Jawalpurram remains have clear African MSA affinities (and hence are likely to be product of our species) and these date from before the Toba event, which could well have also helped in the reduction of Eurasian heterozygosity even more, some 74,000 years ago. And there are other archaeological clues that, while not clearly conclusive, may suggest an expansion into Asia since as early as c. 110,000 years ago.

Sure, it would be also a good idea to ponder carefully about the role of the Middle Paleolithic colonists of Palestine in the whole process if that is possible. I have nothing against that but I still don't like their reasoning in this point.


The branching out of Eurasians and the two South Asian components

The neighbor joining trees (see fig. 3 above and also fig. S1 at the supplemental materials, very similar) are one of the most interesting results of this paper and the authors are clearly proud of them.

I am going to ignore this "detail" hereafter but I must however mention that the tree produced in fig. S2, after the inclusion of a North African and two Palestinian populations is however very different. This is strange but I don't know how to handle this discrepancy. It might be a point of support for their hypothesis of a long separate coalescence in the Levant? Can't say.

The two other trees however really produce a result that is an almost perfect fit with haploid phylogenies, with Eurasians branching in two in Tropical Asia (South and East Asian branches) first of all.

Then the South/West Eurasian branch shows a division between South Indians and the rest, what I interpret as a split happening still in South Asia prior to the colonization of West Eurasia. Then Pakistanis and West Eurasians branch apart and then the same happens with Europeans diverging from the West Asian/Caucasus population.

Some of the branches' positions however may be caused by ulterior admixture so let's be careful with that.

The authors also emphasize the finding (consistent with what we have seen in other papers) that the second South Asian component, related to West Eurasians, is essentially of West Asian/Caucasus affinity and not European.

I agree with this and I think that it is an important point to make. It seems to imply that an important genetic flow has existed from West Asia into South Asia, specially the Northwest part of it. Of course the flow may have happened at different historical and prehistorical periods but it is important to realize that the Neolithic Age was surely when such migrations might have caused a greater impact.

In contrast some of "European" (darker orange) component is also visible, maybe originating in the Indoeuropean flows and maybe replaceable by a more specific Central Asian component (sadly Central Asia and Siberia is only sparsely sampled in this paper) if the findings of Hui Li are to be reproduced in the context of proper sampling strategies in this delicate area. Whatever the case the European input in South Asia is very minor, even if maybe slightly larger than among West Asians/Caucasians. We can safely infer, I understand, that it reflects the real Indoeuropean genetic input via Central Asia.

Most importantly a clearly distinct South Asian component (purple) has been detected and is strong enough to make up 50% of the Pakistani gene pool and almost the totality of some South Indian populations. Also notice the distinctive Irula component (blue), which may reflect the particular long isolation of these tribals, in the past tentatively classified as "Negritos".

Notice also the minor but significant presence of the Indian component in SE Asia, specially in Thailand. I have on occasion noticed that some Thais seem to have a distinctive phenotype and maybe this is the explanation.


East Asians and Native Americans

In this aspect I want to say that I am not totally persuaded by the authors' claim of greater Central Asian affinity of Native Americans. The main reason is that the "Central Asians" they mention such as Nepalese or Kyrgyzes are possibly admixed populations that owe their position in the NJ tree to that fact.

Even the Buryats appear to show some of that admixture. In this case (and maybe in the others too) it is probably a case of Central Asian specific components indeed but components that still may reflect a very ancient admixture event in the early Upper Paleolithic process of colonization of Central Asia and the Far North.

This is a limitation of this paper: they do some chest beating about a very throughout sampling (somewhat justified indeed) but in the case of Central Asia/Siberia they are lacking and the matter seems to be left unclear.

In any case, Native Americans or rather their ancestral founder population does look like having coalesced in a complex Central Asian and Siberian sparsely populated ancient landscape prior to their arrival to Beringia and subsequent colonization of America. Haploid genetics is very strongly supportive of such scenario.

It is difficult to ascertain however whether their high divergent location in the NJ tree, in the context of the East Asian branch, owes to them having diverged very early or rather (as I suspect) to their early admixture event, maybe partly shared with Central Asians and Siberians. We would need a much improved sampling strategy in those areas to be able to get some clear ideas.

Otherwise East Asians appear to show a first division between NE Asians and SE Asians, with the divide running across China. Not much more can be said, as the sample has not sufficient coverage, specially in SE Asia and Oceania.


African curiosities

One of the details of the trees that called my attention is that, in contrast to what happens in simplified haploid genetics, Pygmies are more distant from the rest of Humankind than Khoisan. This has an explanation, I believe, as the lineages more tightly associated with the Khoisan such as mtDNA L0 and Y-DNA A have representatives in NW Africa and even Arabia, indicating a protracted divergence (or repeated re-convergence) between the southern proto-Khoisanid branch and the main proto-Afro-Eurasian one. Instead when proto-Pygmies diverged they probably did for good, in spite of recent admixture with Bantus and some ancient lineages also shared with West Africans at minority levels.

Another such detail is that the populations most closely related to Eurasians are East Africans (Hema, Luhya, Alur). Overall the African branching process is coherent with the scenario I described here at Leherensuge some months ago.

Hybridation pros and cons


An issue that has arisen more than once in discussions as of late, specially in relation with the recently discovered
Neanderthal admixture in Eurasian Homo sapiens, is that of hybrid vigor or lack of it thereof. This is addressed at a new paper in PLoS Biology:

Ulises Rosas et al., Cryptic Variation between Species and the Basis of Hybrid Performance. PLoS Biology 2010. Open access.

Author summary:

A major conundrum in biology is why hybrids between species display two opposing features. On the one hand, hybrids are often more vigorous or productive than their parents, a phenomenon called hybrid vigor or hybrid superiority. On the other hand they often show reduced vigour and fertility, known as hybrid inferiority. Various theories have been proposed to account for these two aspects of hybrid performance, yet we still lack a coherent account of how these conflicting characteristics arise. To address this issue, we looked at the role that variation in gene expression between parental species may play. By measuring this variation and its effect on phenotype, we show that expression for specific genes may be free to vary during evolution within particular bounds. Although such variation may have little phenotypic effect when each locus is considered individually, the collective effect of variation across multiple genes may become highly significant. Using arguments from theoretical population genetics we show how these effects might lead to both hybrid superiority and inferiority, providing fresh insights into the age-old problem of hybrid performance.

A news article synthesizing the findings can be found at Science Daily:

The results show that hybrids might be expected to exhibit increased performance in basic traits such as growth. However, they also show that in the longer term, other traits such as those involved in sexual reproduction might be expected to perform less well, accounting for reduced fertility of hybrids.

Saturday, July 3, 2010

Central Eurasian genetic specifity detected


Found at
Dienekes and GNXP:

Hui Li et al., Genetic Landscape of Eurasia and “Admixture” in Uyghurs. AJHG 2009. Now freely available at PubMed.

The interesting stuff is in figure 1:


So we have now a cluster centered at the Khanty (an East Uralic population) but strong in Central Asians that is distinct from both West and East Eurasians.

I think this is the coolest discovery of autosomal genetics in quite a long time.

Dienekes protests about the inconsistence of this with Y-DNA but I fail to see the connection, because Y-DNA or even mtDNA, surely scattered in the early Upper Paleolithic when Eurasians were still very much undifferentiated, while these components are surely shallower and represent regional homogeneization processes that happened surely only after the LGM. Also the impact of Y-DNA flows may be really weak: Buriats and Finns share Y-DNA lineage, as do Polish and many Indians or West Europeans and some Central Africans but it's obvious that these don't correlate too well with autosomal genetic clustering which has its own processes of regional homogeneization, while haploid genetics and specially Y-DNA is subject to high odds of fixation by mere drift and founder effects.

Razib says that the authors seem to be arguing for greater number of (strategically chosen?) populations, what makes total sense and has served, when done, to add many shades to the tricomy of the old HapMap continental hyper-simplification.

However it's very possible that a deeper cluster analysis would have revealed futher clusters, maybe an Indian one (very small sample though) or a distinction between the Khanty and Central Asians or...

Where does this Central Eurasian cluster stem from. I'd say, based on haploid genetics, that it was probably created by the admixture of a West Eurasian and East Eurasian migration converging in that peripheral area and then coalescing into a rather homogeneous cluster on its own right. That would explain why the population appears almost exactly intermediate between the two major continental groups and also why there is no haploid lineage that specifically belongs to that region (all are shared with either West Eurasia or East Asia).

East Asian variations

It is noticeable that three quite distinct populations emerge in East Asia: inland, coastal and south. These are probably essentially comparable with the blue, yellow and one (or all together) of the SE Asian components detected in the HUGO Consortium paper.

Thursday, June 10, 2010

Jews are "Phoenicians", Palestinians are "Jews"


[Update: please read my 2012 independent analysis of Western Jews, Palestinians and other populations of West Asia, which adds some interesting nuances but in essence confirms what is said here].


This does not seem just another paper on Jewish genetics but more like The Paper. While it is pay per view and hence I haven't been able to read it in full , the material I could see at Dienekes' blog (same as in the supplementary material) is most revealing. I think this research will mark a before and after in Jewish genetics and also gives some interesting hints on other populations, specially in West Asia and North Africa.

Doron M. Behar, Bayazit Yunusbayev, Mait Metspalu et al. The genome-wide structure of the Jewish people. Nature, 2010. Pay per view but supplementary material freely accessible.

One of the good things is that finally comparison with Turks and other populations from that area where early Jewish Diaspora in the Hellenistic-Roman era is known to have lived, rather than in Palestine, in a time when Judaism (several sects including eventually Christianism) was still actively proselytizing.

Unlike what I used to think, Western Jews (Sephardi and Ashkenazi) do not cluster too well with the Turkish sample but they cluster almost perfectly with Cypriots and Lebanese. They seem to have no particular relation with Palestinians (nor Druze nor Negev Bedouins) but these also appear clearly different from other Arabs and in general any other sampled population.


This K-means analysis is for me the answer to all these endless discussions on the origin of Jews and Palestinians. Western Jews seem essentially to have coalesced in the Cypriot-Phoenician area probably by, essentially, conversion. Palestinians seem to be a uniquely distinct population, albeit somewhat admixed with their neighbors, which may well originate with the local Neolithic and certainly must have been there in early historical times.

In other words: Palestinians are most likely to be the true descendants from the Jews of the Biblical period, rather than modern Western Jews who seem more as originating from a Phoenician-Cypriot population which converted to Rabbinic Judaism for whichever reasons.

Other Jewish populations also seem to originate in conversion episodes but from different genetic pools. Hence Yemeni Jews appear as genetically Arab, Ethiopian Jews as Ethiopian, Indian Jews as Indian and Iraqi-Iranian Jews as Iranians. There may be some fine threading to enrich this overall picture but the essentials seem very clear in any case.

Anyhow, Moroccan Jews appear as just another branch of Western Jews (no particular relation with Moroccans is apparent) and I have not been able so far to identify the closest population to the small sample of Uzbek Jews. Also Turco-European Jews seem at least somewhat admixed with Europeans, something that was already well known.

As for other populations, I find interesting that an specific autosomal component of NW Africans has been detected (for the first time as far as I can tell). Many specific clusters have obviously not been detected because of the relative shallowness of the K-means analysis.

The supplementary materials have other interesting graphs, PC analysis of autosomal, Y-DNA and mtDNA genetics and a global K-means analysis of relevance when observing some peripheral Jewish populations specially but also providing some general hints on other populations (a very wide sample, specially in Eurasia).

I must cheer and congratulate the authors of this research for finally addressing the debate on Jewish (and Palestinian) origins with a worthy extended sample of many many populations, including key ones such as Turks, Cypriots and Lebanese (among others). The wording of the abstract doesn't say things as clearly as I do but their data speaks volumes.


Update: A reader, Joe, tells me that H.G. Wells already suggested this Phoenician true origin of Jews. In his book A Short History of the World, chapter XXII, he wrote, speaking of Semitic peoples, once all powerful but then defeated by the Indoeuropeans (Persians, Greeks, Romans):

Is it any miracle that in their days of overthrow and subjugation many Babylonians and Syrians and so forth, and later on many Phoenicians, speaking practically the same language and having endless customs, habits, tastes and traditions in common, should be attracted by this inspiring cult [Judaism] and should seek to share in its fellowship and its promise? After the fall of Tyre, Sidon, Carthage and the Spanish Phoenician cities, the Phoenicians suddenly vanish from history; and as suddenly, we find not simply in Jerusalem but in Spain, Africa, Egypt, the East, wherever the Phoenicians had set their feet, communities of Jews.


See also the discussion on Atzmon 2008.


Update Nov 21: a free copy of the paper is available here (PDF).

Monday, June 7, 2010

Genetic comparisons of Basques and Jews


This past week I have been really oblivious to anything that was not directly related to the Zionist criminal assault of the Freedom Flotilla. I really did not feel that almost anything else mattered. Sometimes the tragedy of History just takes all the emotional and mental space and there is not really much room for anything else, I guess you can understand that.

However some more or less interesting stuff has been published in the meantime, in particular two papers on West Eurasian autosomal genetics which have been addressed at Dienekes' Anthropology Blog. So it's time to make a brief mention of them:


Basque genetics and other Europeans

Naiara Rodríguez Ezpeleta et al. High-density SNP genotyping detects homogeneity of Spanish and French Basques, and confirms their genomic distinctiveness from other European populations. Human Genetics. Pay per view.

See: Dienekes' relevant post for abstract, some details and his very questionable opinions, as well as for some discussion among readers.


Particularly questionable is his opinion that Basques should still be genetically identical to all other Iberians, based on one paper's Fst data but ignoring a whole array of other papers. These are (at least) Bauchet 2007 (discussed here), Achili 2007 (discussed here), Tian 2009 and Athaniasiadis 2010 (discussed here).

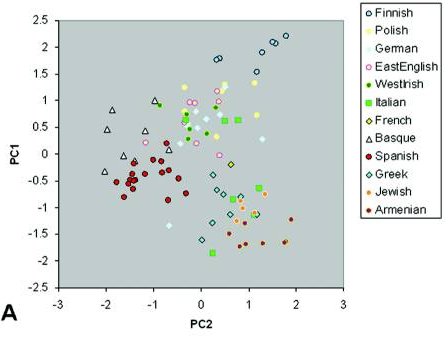
While Iberians are not sampled and plotted, based on the data of Tian 2009, they should show up very close to French and Italians (except the unique Sardinians), slightly above the (0,0) coordinates, in the graph above. Of course, it dependends on which Iberians but I'm talking about the main cluster, not Cantabrians nor Catalans.


Jewish genetics: yet another instance of truth avoidance

G. Atzmon et al. Abraham's Children in the Genome Era: Major Jewish Diaspora Populations Comprise Distinct Genetic Clusters with Shared Middle Eastern Ancestry. American Journal of Human Genetics, 2010. Pay per view (but should be freely accessible in six months).

See also Dienekes' relevant post.

Note: capitalized labels refer to Jewish subgroups. I strongly suspect, based on Fst distances (see second update below), that Palestinian and Bedouin labels are mistaken and should be the other way around.

It really frustrated me once again that Turks (nor Greeks nor Syrians) had been compared with. [note: see update below, this is not true after all and is quite revealing] The most logical hypothesis, based both on historical and the available genetic data, suggests that modern Jews (or most of them) are not so much descendants of historical Jews from Palestine as from a hybrid population that coalesced mainly in Asia Minor in Hellenistic and Roman times.

The above graph does not contradict this hypothesis at all, at least for the main Jewish population of Europe, Turkey and Syria. Irano-Iraqi Jews instead probably had different origins, the same that Yemeni, North African and Ethiopian Jews do as well (not studied here).

The affinity to Adigey (a NW Caucasian people) strongly suggests this, as well as the fact that they seem less Levantine than such an outsider population as are the Druzes (with Anatolian and Egyptian origins, not Levantine). Anyone familiar with European genetics would expect Greeks and Turks to pop up almost exactly where most Jews do.


Comparing with Bauchet-2007

But if you doubt my words, I suggest that you look at Bauchet 2007, which is the only paper so fare that has compared Jews (Ashkenazi) with Greeks and Armenians, resulting in almost total identity in all comparisons (k-means, PC analysis), as well as with South Italians. None of these groups are present in this analysis but they should show up pretty much where the main Jewish cluster is.


PC analysis of West Eurasians (fig. 4-A)

K-means clustering (fig. 4-B)

This paper remains to date one of the main and more clear references to understand European genetics at autosomal level and in particular to understand Basque and Jewish affinities or lack of them.

Together with other materials, some of them listed above, the case is clear:
  • Basques are a distinct subgroup of Europeans, though probably akin to some North/NE Iberians and some South/SW French
  • Iberians are also a distinct subgroup to the exclusion of Basques, even if they overlap at times (but not more than they overlap with Eastern Mediterraneans)
  • Jews seem impossible to take apart from other Eastern Mediterraneans (Greeks, Armenians, South Italians, Adigey) but they seem somewhat distinct from Palestinians, meaning they probably coalesced in Anatolia. The fact that Zionist researchers systematically avoid comparing with Turks, Greeks, etc. probably means that they know this is true but want to hide it.
If you still doubt of the distinctiveness of Basques in relation to Iberians, I would recommend to look at this other PC graph from Achilli 2007, even if it is about mtDNA, where the case is very clear even with a very small Basque sample in an ocean of other European and many different Iberian samples. Iberians do look quite diverse anyhow but none of them really clusters with Basques:


Update: Jewish genetic affinity with Turks and Cypriots revealed in the supplementary material.

Someone has sent me a copy of Atzmon's paper and I must correct my previous statement that no Turks were sampled. In fact there is a small sample of Turks and Cypriots which cluster very closely with the main Jewish group (Euro-Turco-Syrian Jews):


I can't tell at the moment if the subgroup that clusters most closely are Turks or Cypriots or a bit of each but that is all what is in the ESE control group. There are also a couple of NW Europeans who also cluster very tightly and are most likely descendant of recently assimilated Jews (maybe in the time of the Holocaust, when some families found that such was their only hope of survival).


Update: Fst distances

Table 1 is pretty interesting, even if it lacks the Turkish/Cypriot sample, in particular the Fst distances. In it, it seems quite obvious that Iranian and, to a lesser extent, Iraqi Jews are different populations from the main Jewish cluster of this study, that I will call hereafter Western Jews (incl. Turkish, Greek, Syrian, Italian and Ashkenazi subgroups). The most representative subgroup of this "Western Jewry" of Hellenistic-Roman origins are probably Turkish Jews (labeled TUR in the study), followed closely by Greek Jews (GRK) and then Syrian, Ashkenazi and Italian Jews.

In order to simplify, I averaged Fst distances within this group, resulting in the following pairwise comparisons with other populations (bold type):

North Italian - 0.006 (0.004) [0.010]
Palestinians - 0.008 (0.005)
French - 0.009 (0.007) [0.014]
Druze - 0.009 (0.007) [0.009]
Iraqi Jews (IRQ) - 0.010 (0.009) [0.010]
Adygei - 0.010 (0.008) [0.012]
Sardinian - 0.012 (0.010) [0.017]
Bedouin - 0.013 (0.010) [0.009]
Iranian Jews (IRN) - 0.016 (0.014) [0.017]
Basques - 0.016 (0.014) [0.021]
Russians - 0.016 (0.014) [0.021]

Figures in regular brackets (...) are Fst pairwise distances with Turkish Jews (TUR) only, while figures in square brackets [...] are distances with Palestinians.

For reference, the average Fst distance between Western Jewish populations with each other is 0.005 (0.004 of Turkish Jews with the other Western Jews on average).

Wednesday, May 26, 2010

New paper on Spanish genetics


There's a new paper of some interest on Spanish population genetic structure:


J. Gayan et al. Genetic Structure of the Spanish Population. BMC Genomics. Open access.

The main aim seems to be to provide a Spanish dataset for population genetic research. And so far so good.

However the sampling strategy is awkward to say the least:

In the above map (my creation on the paper's data), red dots indicate sampling locations, while blue areas are regions (autonomous communities) not included in the sample. Most noticeable is that not just the Basque Country has been excluded but also all the surrounding area.

As I say, quite awkward.

Other surely distinctive unsampled areas are the Canary Islands and Galicia.

The whole design of the sample has a Castile-centric bias that is difficult to understand.

But, well, that's what they did. And, once we know that, we can go on to look at the results:

In this graph (fig. 6 annotated by me) we can see how Catalans and Andalusians tend to diverge from neutrality in orthogonal directions. To a less clear extent, the North Castilian samples (Arévalo, Segovia) also diverges somewhat.

We can say that PC1 describes a Catalan-other axis and PC2 an Andalusian-other one. The lack of distinctiveness of some geographically eccentric samples such as the Asturian one (Avilés)may well be caused by the small size of the sample. It is very possible that a PC3/PC4 graph would evidence some distinctiveness that is not apparent here.

Remember that PC graphs are merely bidimensional representations of some of the apparent structure, with all the limitations that this implies.


European comparison

When compared with other populations of European ancestry the PC graph is as follows (annotations by me on fig. 7):


Catalans appear to have some tendency towards Italy and NW Europe, while the less defined eccentricity of Andalusians only seems to tend towards Italy. There are also a couple of Castilian individuals who cluster with NW Europeans, maybe because the North Castile area sampled was the core of Visigothic settlement (just a hunch).


Global comparison

There's not much to say about Spaniards in the global scatterplot (fig. 8), really: all Europeans just cluster very tightly, the same as East Asians (Chinese and Japanese).

What I found intriguing and worth posting this graph is the curious coincidence of the scatter of Kenyan Maasai (MKK) and US African-Americans (ASW). Notice that the LWK sample (Luhya) are also from Kenya but Bantu and they cluster best with Nigerian Yoruba (YRI). Not really sure because it'd need further research but certainly the almost identical disposition of MKK and ASW samples is suggestive of the Maasai (and maybe other Nilotes) being somewhat admixed with West Eurasians. Alternatively the distribution might be reflecting some African-specific differences (just like Indians in the Eurasian context) and its overlap with African-Americans is to some extent an artifact of the limitations of PC analysis.

I do miss a comparison with North Africans, which seems to be a taboo in Iberian and European population genetic studies. However I do detect (and not only here) a slight "African" tendency among some Iberians which may well reflect a greater affinity with North Africans, in turn slightly more akin to ultra-Saharan Africans. This would be an interesting matter to analyze.


Update: I totally forgot to mention that just a few days ago I commented on another paper by a Catalan team that did compare Iberians and North Africans, which may serve for comparison. The results appear wildly different in the PC graph, with Catalans, Basques and Cantabrians clustering on one corner and the other Iberians scattered with a clear tendency towards the Eastern Mediterranean. No apparent North African affinity was detected.

Tuesday, May 25, 2010

Some DNA sequences have mutation rates 10-50 faster than normal


Just a quick note for the reference.


Methylated CpG sequences in DNA (C-G sequences noticed as CpG to make them apart from C-G bonds between the two 'mirror' DNA chains) have a much faster mutation rate than all other DNA. This is because the group, apparently related to the immune system often, is most unstable what yields a mutation rate 10-50 times faster than for the rest of DNA.

This may have implications for the molecular clock hypotheses but I'm not sure in which sense right now.

More information at Science Daily.

Ref. J.C. Walser and A. Furano, The mutational spectrum of non-CpG DNA varies with CpG content. Genome Research 2010. Pay per view.

Saturday, May 22, 2010

Archaeology versus some bad Genetics


I just stumbled upon a somewhat old but very interesting article on why population genetics has gone mad and leaned towards Neolithic replacement against all archaeological evidence. Why? Because they never cared at all about the archaeological evidence, not even about the genetic evidence that contradicted their own conclusions: they have been acting ideological all this time. Sadly enough.


Mark Pluciennik, Clash of Cultures? Archaeology and Genetics. Documenta Praehistorica 2006. Freely available PDF.

Worth a read, really.

Tuesday, May 18, 2010

New paper on Mediterranean genetics


We have a new free interesting paper by researchers of the Universitat de Barcelona on the issue of the Mediterranean partial barrier to genetic flow:

G. Athaniasadis et al., The Mediterranean Sea as a barrier to gene flow: evidence from variation in and around the F7 and F12 genomic regions. BMC Evolutionary Biology 2010. Open access.

The F7 and F12 genomic regions refer to a diverse set of neutral and functional polymorphisms located in and around the coagulation factor VII and XII genomic regions (F7 and F12).

Conclusions

As there is no consensus between the two genomic regions regarding gene flow through the Sahara, it is hard to reach a solid conclusion about its role in the differentiation between the two Mediterranean shores and more data are necessary to reach a definite conclusion. However our data suggest that the Mediterranean Sea was at least partially a barrier to gene flow between the two shores.


They compared a set of diverse populations from North West Africa, Iberia and Occitania (South France) and the Aegean area, using also samples from Ivory Coast and Bolivian natives as outgroups.

As the authors admit some uncertainty remains at not sampling some important Mediterranean regions. They mention Italy and the Adriatic but I'd say that a study like this would benefit from including mainland Greeks, other West Asians (Levant specially) and Egyptians, as well as some NW European outgroups (Scottish?).

I do welcome anyhow the sampling of Occitans, a much needed comparison from the viewpoint of Basque and Iberian genetics in particular.


From the study I have selected this PC graph (above) as most representative of their conclusions (fig. 3C). As I like to do, I have made some annotations in various colors: in red locations of the samples (so you don't have to check fig. 1 all the time), in gray the PC axes, in blue their possible meaning (my best hunch).

I have also marked two rather tight clusters (High Atlas and Pyrenees), both with a marked tendency to one pole of the PC2 axis, and two less clearly defined ones (Other North Africans and a mish-mash of Andalusians, Occitans and Cretans).

The High Atlas (or South-SE Moroccan) cluster is the most neatly distinct of all and shows very strong tendency in both PC axes. The African tendency (-PC1)>

The Pyrenean (or North-NE Iberian) cluster shares the same characteristics but with a clear European tendency instead of an African one.

The 'Other North African' cluster is really loose and is only defined because of the differences to the rest of groups, which should have been relativized if Egyptian and Levant samples would have been included most probably. Notice that the +PC2 pole, that I have dubbed 'Neolithic' just indicates an apparent more West Asian tendency, which might or not be Neolithic as such.

The Andalusia-Toulouse-Crete cluster is probably an artifact caused by their neutrality in the West Europe-West Asia (Paleo-Neolithic) axis rather than a true clustering. In any case, the clustering of the Cretan sample with SW Europeans is consistent in all three PC graphs what suggests that, at least in this aspect, Cretans are not so close to Anatolians as geography, history and haploid genetics suggests.

Also, the position of Asturians is very noticeable because they do not cluster at all with Pyrenean peoples but rather seem intermediate between the SW Europeans with a more Medeiterranean tendency (Andalusians, Occitans) and the Turkish sample. Knowing that in other markers, such as Y-DNA, Asturias tends to cluster with other West Iberian regions (Galicia, Leon, Portugal, Extremadura) one wonders if there was demic replacement in that country and, if so, when did it happen. Because it is something that is not obvious at all in the archaeological nor the historical records.

Tuesday, May 11, 2010

New analysis of African mtDNA


There is a new paper on 'African' mtDNA L(xM,N) with a focus on trans-Saharan flow:


Nourdin Harich et al., The trans-Saharan slave trade - clues from interpolation analyses and high-resolution characterization of mitochondrial DNA lineages. BMC-Evolutionary Biology 2010. Open access.

The authors conclude that all or most of this mtDNA flow happened in recent times within the trans-Saharan slave trade, mostly in the last few centuries of Arab domination. I think that this position is simply untenable (and I'd dare say falling into 'romantic' Orientalism per many of the reasonings like: some harems could be enormous, reaching even the extravagating number of 14,000 concubines) but there is interest anyhow in the data managed (from many other different studies mostly) and specially in the many nice distribution maps provided.

They do not only fall into pseudo-romantic visions of the slave trade and its importance but also fall in another pool of moving sands: excessive reliance on the molecular clock age estimation methods, when they draw their conclusions.

I really fail to see how MC age estimates of c. 10-15,000 years ago (L3) can justify a recent shared ancestry within the slave trade. They would actually point, if anything, to late Paleolithic or Epipaleolithic migrations (Capsian culture?) There is only one case with a more recent date in all the L3 comparisons but it's not between an Tropical and Mediterranean Africans but between one Jordanian and one North American (Afro-American?) Instead there are many L3 cases with older age estimates: up to 37,000 years ago.

They do not have age estimates for the other haplogroups, specially some L0 and L2 sublineages that also permeate the Sahara-Red Sea barrier.

As I have said before, some of these lineages look very old North of the Sahara (see here) and may have been pouring towards the North and NE since around the out-of-Africa migrational episode, which may be c. 120,000 BP, quite roughly.

They fail to analyze two particular haplogroups that are apparently more common North of the Sahara and East of the Red Sea: L3k and L3i respectively (L3i is plotted on a map but North African specific L3k is totally ignored).

As I said above, the best is the distribution maps, which allow for a quick visual impression of the distribution of the L(xM,N) lineages. Form these I think that:

  • L0a shows a clear South-East Africa-West Asia distribution, with some very high concentrations in this last region. I previously mentioned that I think that L0a1b2 and L0a1c (?) are clear candidates for a Middle Paleolithic flow to West Asia related to the OOA migration.
  • L1b surely had a Middle Sahelian origin but also clearly permeates across the Sahara. Within it, L1b1a2 is typical of the Red Sea area, while L1b1a5 is found in Mauritania and Cyprus (per Behar 2008). I think that its expansion happened some time after the L3 one (29 CR mutations to the root vs the 23 of L3) but may well belong to the late phase of the Abbassia Pluvial.
  • L2a is so ubiquitous that cannot be analyzed as a whole. The timeline of its expansion is surely the same as that of L1b (again 29 CR mutations to the root) but it's much more impressive in its dimensions. Some of the high level sublineages (L2a1j) are exclusive of the Mediterranean, while some others are shared across the desert and surely deserve specific attention if we want to clarify anything.
  • L2d. The map concentrates this lineage in West Sahara but (from Behar 2008) it's actually also present in Ethiopia, Algeria and Yemen. It's another candidate for an old lineage beyond the Sahara.
  • L3b also looks pretty much North African/West Asian but has also presence in West and East Africa.
  • L3d is an even more clear case of a North African/West Asian lineage: rare south of the Sahara and very common north of it.
  • L3e looks by the map as split in a North African and a Bushman clades, however by Behar's data the situation is much more complex: scattered in many distinct African and West Asian populations, all very suggestive of an old spread within the L3 explosion (OOA related).
  • L3f looks like spread from Sudan in all directions early on as well.
  • L3i is shown as the Red Sea-South Arabia lineage it is and is a very strong candidate for OOA migration remnant in Southern Arabia. Can never be attributed to 'slave trade' but it's most probably the "little sister" (niece in fact) of M and N. It is actually closer to the L3 root than M and N by CR mutation count, so it's surely older, just that it did not reach South Asia.
  • L3x is a very similar case, however it should be slightly more recent than L3i, with an age similar to that of the N and R explosions in further Asia.
  • I'm wondering if L3w is just another name for L3k. It does not exist in PhyloTree but the distribution (Algeria, Ethiopia) is reminiscent of the one reported for L3k elsewhere.
There's no mention to L6 and L4b, both of which are also candidates for participation in the OOA flow to South Arabia.

In brief: it seems that the preconceptions of the authors are preventing them to reach to rational conclusions. The paper has some interest but this lays mostly on the illustrations (maps). Hopefully, as it happened with the similarly confused Balaresque paper, someone else (Morelli in this case) will take the bull by the horns and do something better with all that data.

Related posts: