I'm borrowing here the work of Aargiedude (again) because it's such a priceless addition that it really deserves to be paid some attention. If professional geneticists would be half as serious as this amateur, we'd know a lot more and a lot better about our the population history of humankind by now.
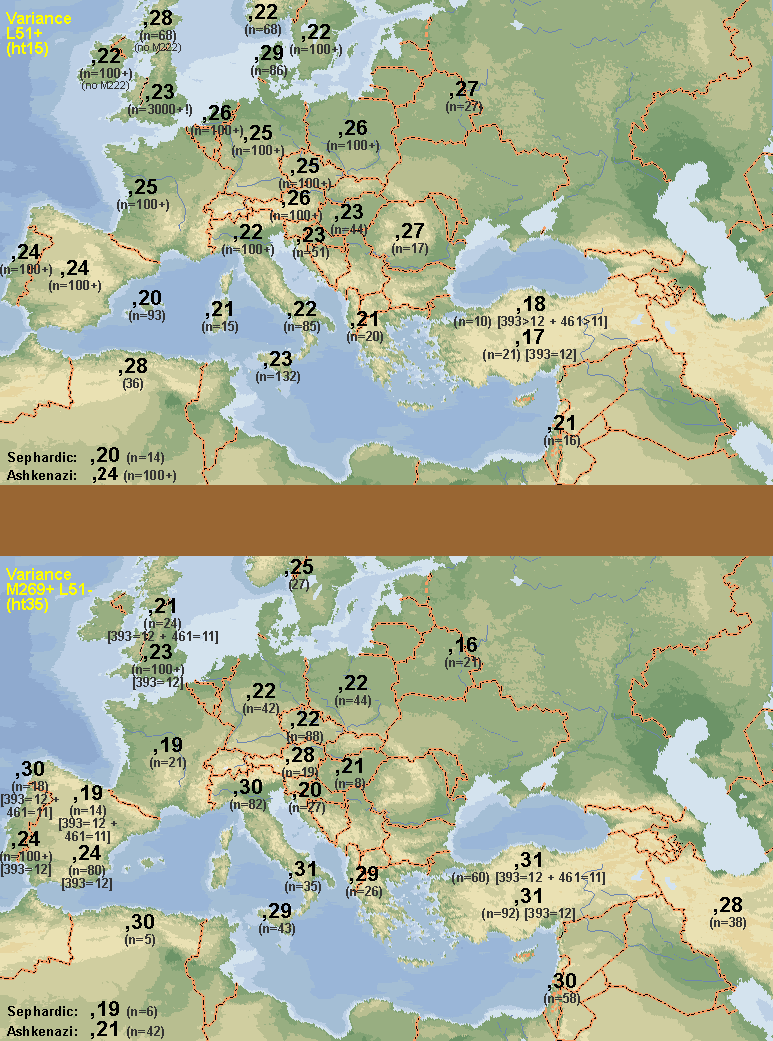
These two maps represent the haplotype diversity of R1b1b2a1 (ht15) and R1b1b2* (ht35) respectively:
Aargiedude's own observations at Dienekes' blog follow:
I've finished estimating ht15 and ht35 diversity, it's taken me 2 days to do this, and I think the results are amazing. The diversity clines of ht15 and ht35 are almost polar opposites. I think these results seriously call into question the conclusion of the Balaresque study, which is what prompted me to look into this. There's no surfing-on-an-expanding-wave phenomenon occuring with ht15. It has its lowest variance in the supposed origination point: Anatolia.
Instead, as Maju pointed out brilliantly, the study's tree diagram of their R1b1b2 haplotypes seems the result of 2 separate events, not a single wave diffusion. And he was absolutely right.
The diversity of ht35 doesn't form a gradually decreasing cline. It seems to be uniformly similar from Iran to west Iberia, or at least up to Italy, because there are issues with the validity of the North African and Iberian data (small sample size in one case and confusion with ht15 samples, in the other). Its cline seems to be more north-south than diagonally from southwest to northeast. East European countries have the same ht35 diversity as West Europe, with the special consideration of the west Iberian results.
Some technical details to keep in mind. Ht15 can be differentiated from ht35 by barely 2 markers: 393 and 461. Few studies test 461, so most of the samples I used were chosen on the basis of 393 alone. But about 3% of ht15 and 10% of ht35 have the "wrong" value, becoming confused with the other group. This usually doesn't matter, exceot in countries where there is an overwhelming ratio difference between the frequencies of both groups, such as in Iberia, France, Britain, Netherlands, Anatolia, and the Levant. In these extreme cases, I've included, where possible, 2 pair of results. The top pair uses samples predicted as narrowly as possible, by using both 393 and 461. The bottom pair is the standard prediction using just 393. The top pair should be more accurate, but they tend to lack in sample size, so then again, maybe not. Notice in the case of Iberia, that the less restrictive result changes drastically from the more restrictive result, and results in identical values to Iberia's ht15 diversity estimate, suggesting most of the samples are in fact ht15 samples that are being confused for ht35 because they had a mutation in 393 to the modal value of ht35 on that marker. Curiously, this didn't happen in France, where I was only able to use the less accurate method (393 alone), and yet the result is notably low and different from France's ht15 diversity. I'd seriously take North Africa's high ht35 result (0,30) with a military-issue teaspoon of salt, it's just 5 samples. On the other hand, it's notoriously high ht15 diversity (0,28) is pretty solid.
To recap, Baralesque and all geneticists are stuck in a time warp, they're back in 2003, thinking R1b is just R1b. What a waste, after going through all the effort of collecting and processing the samples, to not have had the sense to test for a few extra key mutations that define some major subdivisions of R1b1b2 and are well known for more than 5 years. The conclusions they reached would then have been very different.
The Balaresque paper was discussed at Leherensuge a few days ago.


1 comment:
“If professional geneticists would be half as serious as this amateur, we'd know a lot more and a lot better about our the population history of humankind by now.”
Absolutely!
Post a Comment