New blogs

Leherensuge was replaced in October 2010 by two new blogs: For what they were... we are and For what we are... they will be. Check them out.
Showing posts with label Y-DNA. Show all posts

Thursday, August 26, 2010

R1b1b2a1 is almost unique of West Europe

[Typo: in the maps M529, also known as L21, is wrongly written as M259. My apologies]

This is one of the virtues of Myres' paper (that I mentioned yesterday): that a somewhat more clear phylogenetic subdivision is made, emphasizing the difference between West European R1b1b2a and other R1b or R1b1b2, often blurred in previous papers, causing great confusion even to researchers themselves.

A defect is that instead of using a standard name for the defining SNP (L51/S167 per ISOGG) they chose to name it M412. However Argiedude says it is the same marker and I imagine it is. [Update: confirmed: the rs number indicates it is the same SNP].

Another virtue is that some of the substructure of R1b1b2a1 is also mapped, what really covers pretty well the Northern and Italian area of spread of this lineage and even some relatively unmapped areas of SW Europe, specially France.

In any case the apparent structure is curious, so I got the supplementary table S4 (supp. material is freely accessible) and made this map:

Click to enlarge

Notice that, following Argiedude, M412 stands for L51 and M529 stands for L21, what, if confirmed would make the following equivalences:
  • R1b1b2a-M412 = R1b1b2a1 (L51)
  • R1b1b2a1a2-M529 = R1b1b2a1a2f (L21)
Even if not confirmed, the equivalence should be approximate anyhow.

I'm sorry for the horrible color palette but it's my first attempt to make pie charts with Open Office spreadsheet gadget. Next time I'll do better I hope.

Notice also that I did not use all the samples, in the cases of small countries or less relevant regions I arbitrarily chose and discarded some.

Finally notice that pie charts represent only apportions of R1b1b2 and say nothing of the frequency of the lineage overall, which in most of East Europe and West Asia (excepting Turkey and a few neighbors) is extremely low.

The apparent structure of R1b1b2a1

The most apparent structure is, as we already knew the rather different R1b1b2a1a1 and R1b1b2a1a2 distribution. The first one (color coded brown and light blue) is dominant in the North and rather rare in the South - hence: 'North clade' for short hereafter. The second one (dark green, light green, purple and light orange) is by comparison not just more frequent in the South but also probably more diverse as well - hence: 'South clade'. However it is also found in the North.

Then there are some transitional "remnants": R1b1b2a1a* (L11) and R1b1b2a1* (M412). These should be informative (meaning some extra diversity at their structural levels) in order to infer the history of the haplogroup.

Per the hierarchical distribution seen here and diversity data from older works, the most likely origin of R1b1b2 as a whole is Anatolia.

Then R1b1b2a1* (M412) (yellow) is suggestive of a Mid-Danubian (or Italian or Iberian) coalescence.

R1b1b2a1a* (L11) (middle green) is suggestive of a West-Central European (or SW European) coalescence. More data on the Pyrenean region would clarify this maybe.

And, after this layer, comes the division into the widespread Southern and Northern clades mentioned before.

A reasonable interpretation is that the lineage traveled relatively fast upstream of the Danube (and/or via North Italy onto the SW), branching out then into the two major North/South clades. These two lower level lineages are in fact the two main stars of this demographic expansion.

My bet is that this represents a wave of colonization of Europe (when?) with secondary expansions from SW Europe (Franco-Cantabrian region possibly) and Central Europe (Rhine-Danube region I presume). There are several scenarios that can account for this, essentially Paleolithic (or pushing into the Epipaleolithic).

I don't see clearly how this structure could account for a Neolithic spread, really: no Mediterranean Neolithic pattern is apparent at all and Danubian limited expansion cannot account for any spread to SW Europe, certainly not South of the Loire and certainly not at the frequencies it is found there (nor in Britain/Ireland either). Claiming a Neolithic spread of R1b1b2 with this structure can only be done from a very shallow understanding of Neolithic archaeology and prehistory overall.

The main known demographic expansion we know of in the European Upper Paleolithic is the one after the Last Glacial Maximum, when Magdalenian culture expanded from the Franco-Cantabrian region, both northwards to Central Europe and, later, southwards into Iberia. This led to cultural divergence into the Epipaleolithic, with the important expansion into the newly available areas of the Far North, earlier covered in ice. Within the Epipaleolithic some further cultural flows are detected: from the Franco-Cantabrian region into Iberia (Azilian) and from somewhere in Mid-West Europe into the Southwest (Sauveterre-Tardenoisian).

Also, back to the LGM, Magdalenian techno-culture may have got a NW European ultimate inspirational origin but anyhow mediated by the warmer and richer Franco-Cantabrian region, where the culture flourished properly.

It's difficult to reconstruct in detail but, as far as I can tell, the two main North/South clades must have expanded in the Magdalenian period (one from the Franco-Cantabrian region, the other from Central-NW Europe itself) and also in the ulterior Epipaleolithic. Neolithic does not seem able to account for much but may have helped to shake the board a bit, specially in East-to-West direction.


Frequency maps

Selected frequency maps from the paper
Click to enlarge

Notice that the expansion of the South clade to the Atlantic islands does not invalidate its southern character and probably represents an Epipaleolithic-to-Neolithic spread.

Notice also the large amount of unclassified Southern clade in Iberia. The area around the Pyrenees was not really sampled in this study and therefore it is distorted by neighbors ("South France", looking more like SE France, Valencia and Cantabria).

In order to appreciate better the real thing in this aspect it's probably good to take a look at Cruciani 2010, who did bother to sample near the Pyrenees and gets maybe better (or at least complementary) maps illustrating the same problem.


Update: I superimposed (with complementary colors) the South (red) and North (blue) clades from the frequency maps above. However in order to account for the differences of frequency, I had to lighten the blue shade (North clade) because the scales are different. Take it as an "artist's impression" anyhow:


Update (Aug 27):

Here there is a hopefully better version of the map at the beginning of this post:

Click to enlarge

I put special care in giving each distinct clade an specific color range for easier visualization. All R1b1b2a1 (M412/L51/S167) seems to have coalesced in the Central-to-Western European area but the real expansion seems to have happened after this haplogroup split in two, which I dubbed the North and South clades.

And this is my reconstruction of the haplogroup expansion:

Click to enlarge
Color coded as above


Update (Aug 28):

Take a peek at the comment section, where I briefly discuss molecular clock difficulties and also the only possible Neolithic scenario for R1b1b2a1a2 (South clade): a massive demographic expansion in the context of Megalithism.

Rejecting or confirming this would require greater research in the structure hidden "under the asterisk" in SW Europe. At the moment only two minimally-sized sub-haplogroups are known: Basque/Gascon-specific R1b1b2a1a2b and sub-Pyrenean R1b1b2a1a2c (Gascon, Catalan, etc.). This alone gives highest structural diversity to the Pyrenean region, however most of the South clade remains unresolved (hidden under the asterisk), both in the Pyrenean area as in Iberia proper. And the key issue to solve would be if R1b1b2a1a2 is most diverse at the Pyrenees, what favors a Paleolithic spread scenario, or in West Iberia (and Brittany/West France), what would favor a Neolithic-Megalithic spread scenario instead.

Also it's maybe important to remind here the excellent STR work of Laura Morelli earlier this year, which was discussed in this article.

Importantly, this graph (annotated by me):


The graph is suggestive of the existence of another "West Asian" distinct haplogroup "under the asterisk" (that I labeled "R1b1b2a2?") and a possible Balcanic, rather than Anatolian origin for the R1b1b2 clade.

If so, this would correlate with the high diversity of the (much smaller) brother haplogroup R1b1a in the Italy-West Asia arch (as well as in Central Africa) and would suggest a slightly different origin and scatter for R1b as a whole (ref 1, ref 2).

Wednesday, August 25, 2010

A couple of new genetic papers I'd love to read


But by the moment just mentioning them briefly.


Both are published by the European Journal of Human Genetics (Nature) and both are mentioned by Diekenes today (link 1, link 2).


African genetic structure shows novel elements

There has been some negligence in mapping the genetic structure of African populations, with most papers taken a West African proxy (typically Nigerians), sometimes enriched with some of the last hunter-gatherers of the continent, to represent the whole complexity of the ancestral continent.

This paper seems to address this lack.

Martin Sikora et al., A genomic analysis identifies a novel component in the genetic structure of sub-Saharan African populations. EJHG 2010. Pay per view.

Abstract

Studies of large sets of single nucleotide polymorphism (SNP) data have proven to be a powerful tool in the analysis of the genetic structure of human populations. In this work, we analyze genotyping data for 2841 SNPs in 12 sub-Saharan African populations, including a previously unsampled region of southeastern Africa (Mozambique). We show that robust results in a world-wide perspective can be obtained when analyzing only 1000 SNPs. Our main results both confirm the results of previous studies, and show new and interesting features in sub-Saharan African genetic complexity. There is a strong differentiation of Nilo-Saharans, much beyond what would be expected by geography. Hunter-gatherer populations (Khoisan and Pygmies) show a clear distinctiveness with very intrinsic Pygmy (and not only Khoisan) genetic features. Populations of the West Africa present an unexpected similarity among them, possibly the result of a population expansion. Finally, we find a strong differentiation of the southeastern Bantu population from Mozambique, which suggests an assimilation of a pre-Bantu substrate by Bantu speakers in the region.

This Mozambican specificity was already spotted accidentally in Patin's paper on Pygmy Genetics last year but himself downplayed its importance because of his focus on Pygmy structure specifically.


West European R1b is distinct

Nothing really new for those who have kept a keen eye on the research of this Y-DNA haplogroup, the most characteristic of West Europe. But I'd still like to know more about the details. I doubt I could concur with the suggested timeline in any case.

Natalie M. Myres et al., A major Y-chromosome haplogroup R1b Holocene era founder effect in Central and Western Europe. EJHG 2010. Pay per view.

Abstract

The phylogenetic relationships of numerous branches within the core Y-chromosome haplogroup R-M207 support a West Asian origin of haplogroup R1b, its initial differentiation there followed by a rapid spread of one of its sub-clades carrying the M269 mutation to Europe. Here, we present phylogeographically resolved data for 2043 M269-derived Y-chromosomes from 118 West Asian and European populations assessed for the M412 SNP that largely separates the majority of Central and West European R1b lineages from those observed in Eastern Europe, the Circum-Uralic region, the Near East, the Caucasus and Pakistan. Within the M412 dichotomy, the major S116 sub-clade shows a frequency peak in the upper Danube basin and Paris area with declining frequency toward Italy, Iberia, Southern France and British Isles. Although this frequency pattern closely approximates the spread of the Linearbandkeramik (LBK), Neolithic culture, an advent leading to a number of pre-historic cultural developments during the past ≤10 thousand years, more complex pre-Neolithic scenarios remain possible for the L23(xM412) components in Southeast Europe and elsewhere.

M412 seems to be a novel SNP not yet reported at ISOGG. S116 (defined as its major subclade) used to describe R1b1b2a2, most diverse around the Pyrenees (unless this paper says the opposite). So I doubt the LBK hypothesis can hold, regardless of frequency.

Saturday, July 24, 2010

Sex chromosomes complex history in primates


Just a quick mention of what seems to be an important piece of research in the evolution of sex chromosomes in humans and primates in general. The main finding being the existence of a number of evolutionary gene conversions (transference between the X and Y chromosomes, in either direction).


Mineyo Iwase et al. Frequent gene conversion events between the X and Y homologous chromosomal regions in primates. BMC Evolutionary Biology 2010. doi:10.1186/1471-2148-10-225. Open access.


Conclusion

Gene conversion events between the X and Y homologous regions have been suggested, mainly in humans. Here, we found frequent gene conversions in the evolutionary course of primates. An insertion of a LINE element at the proximal end of the region may be a cause for these frequent conversions. This gene conversion in humans may also be one of the genetic causes of Kallmann syndrome.

Monday, May 10, 2010

New paper on Y-DNA haplogroup C


Natsuya points me to this new paper on the distribution and likely spread of Y-DNA haplogroup C, with special focus on East Asia and subhaplogroup C3.


Hua Zhong et al. Global distribution of Y-chromosome haplogroup C reveals the prehistoric migration routes of African exodus and early settlement in East Asia. Journal of Human Genetics 2010. Pay per view (but you can read it freely at ZohoViewer).

CONCLUSIONS
We demonstrated the phylogeographic distribution of one of the most ancient non-African Y-chromosome lineages, from which we inferred the prehistoric migration and expansion of the Hg C lineage. We propose that Hg C was derived from the African exodus and gradually colonized South Asia, Southeast Asia, Oceania and East Asia by a single Paleolithic migration from Africa to Asia and Oceania, which occurred more than 40KYA. The prehistoric northward migration of Hg C in mainland East Asia likely followed the coastline and is consistent with the northward migration of other East Asian Y-chromosome haplogroups.
Nothing too new as you can see, however the the data detail and the neighbor-joining trees of haplotypes for C3 and C5 are of some interest, suggesting that C3 probably coalesced a Mid-East Asia (China and surroundings) rather than SE or NE Asia.

C6 was not located anywhere, suggesting that it's just a very minor clade. In contrast South Asian specific C5 was detected among 2.5% of Indians and 1.5% of Southern Pakistanis, reminiscent of a back-migration from SE Asia by the same "coastal route" that was used to reach SE Asia at an earlier moment.

It's interesting also the still rather high amount of undefined C* found in various areas: 4.6% in Philippines, 5.6% in East Indonesia, 5.9% in Micronesia, 5.6% in Australian Aborigines, 9.1% among the Mulau of Guangxi, 6.9 among the Shui of Guizhou, 7.6 among the Yao of Guangxi, 7.7 among the Tujia of Hubei, 8.2 among the Hui of Ningxia and 6.7 among the Hezhe of Heilojiang. It is also potentially interesting the 0.5% in India because it might have greater densities in some of its very diverse populations (but it's treated as a single homogenous sample in this paper).

Monday, May 3, 2010

Finally some good research on R1b1b2!

This is a most important paper for those interested in Y-DNA R1b and specifically European and West Asian R1b1b2:

Laura Morelli et al., A Comparison of Y-Chromosome Variation in Sardinia and Anatolia Is More Consistent with Cultural Rather than Demic Diffusion of Agriculture. PLoS ONE 2010. Open access.

An excellent critique of Balaresque 2009, totally in the line I was favoring myself.

Most important is maybe fig. 2A, where the use of (novel?) STR marker DYSA7.2, in addition to the usual ones, unveils a clear structure within R1b1b2-M269. I have annotated it for easier visualization:


Click to enlarge


Duality


The already quite obvious Europe-Anatolia (A-B) duality of this haplogroup becomes terribly apparent: two different star-like structures connected by a less clear group (C) centered at the Balcans.


I imagine that sooner than later, someone will come up with a defining SNP for the more than likely Anatolian haplogroup. If I'm correct, with the current nomenclature it should be something like R1b1b2a2. However the root of the whole R1b1b2 haplogroup might also be in that cluster (or is it in C?).

It is surely important to notice that this presumptive R1b1b2a2 haplogroup (at least a clear haplotype star-like structure) also experienced quite apparently a rapid expansion of its own, mostly in West Asia and the Balcans, which is in turn surely related to the expansion of R1b as such through the Mediterranean, Africa (R1b1a) and Central Asia (R1b1b1).


R1b expansion pattern

We may well say that R1b expanded quite dynamically but not with total simple continuity but in colonization "bouts". The first bout is probably best represented by R1b1a scatter in the NE Mediterranean arch (two subclades) and around Central Africa (maybe with a Sudan origin, two subclades too). The second bout is surely a minor one towards Central Asia represented by R1b1b1 (typical of Uyghurs, an odd Chalcolithic founder effect in a previously desert area). The third bout is the spread of R1b1b2-M269 in West Asia and Europe, which represents the bulk of the R1b worldwide in raw numbers.

This third bout is actually two, as is evident in this paper (but was also evident before for those who can "read between lines" at least) but they may have happened in parallel (in which case my annotation above is more strictly correct) or they may have happened sequentially (in which case, lineage B would be R1b1b2a*, except for one of the branches that is actually the root: R1b1b2*).

A quite plausible reconstruction of the spread of R1b (c. 50-30 Ka ago?)
Click to expand


Synthesis

Whatever the case, two things are clear:

1. There is a neat distinction between R1b1b2(xR1b1b2a1) and R1b1b2a1.

2. R1b1b2a1 had its own distinct and fundamentally unique expansion in West Europe, sensu lato.

Also notice that, as happens in previous versions, there are many branches hanging from the R1b1b2a1 central node (modal haplotype also), which appears to contradict the known subhaplogroup structure that only recognizes two branches and which seems to be quite imperfect as of now.


Tempo

As you know I am not any fan of the molecular clock but it's worth mentioning the estimates of this paper for they totally contradict the Neolithic model: the pool of Sardinian and Anatolian R1b1b2 gets an estimate age of 32.6 Ka, the Sardinian one has an age of 27.0 Ka and the Anatolian of 19.6. But the regional ages may be misleading because they include members of both clades, however the overall age should be roughly correct within the molecular clock paradigm.

This would fit with a Gravettian expansion but could also fit with an even older Aurignacian one. It makes some good sense, specially as we are talking of a single expansion that replaced all what was there before, which could only happen at very low population densities, and also because it is a single expansion and not two. It also makes good sense with the likely pattern of expansion of its likely mtDNA companion haplogroup H (also V probably).

As the authors admit, the Magdalenian late glacial recolonization (and noticeable demic expansion) is also within the scope. However I find difficult to explain R1b1b2a1 in Italy within this context, as Italy remained Epigravettian until the very Neolithic. It is also much easier to replace all when there's almost nothing to replace, as was surely the case after the Campanian Ignimbrite supervolcano eruption of c. 40 Ka ago.


Other lineages

The paper is also of interest for other haplogroups such as E, G and J. However I fail to see anything clear surely because of the excessive emphasis in exploring Sardinian-Anatolian connections without a wider scope.


See also: for a completely opposite editorial opinion and likely heated discussion at Dienekes'.


Tuesday, April 13, 2010

Again on Neolithic and European Y-DNA


Specially on why R1b1b2a1 (the bulk of Y-DNA R1b and the Western European specific subclade) cannot be Neolithic. It comes up in all discussions and I really feel the need to explain: to create a generic post that serves as reference.

For that purpose I created a simplified map of European Neolithic cultural flows (excluding mostly Eastern Europe that anyhow had its own distinct processes):

Click to expand


The Early Neolithic

As you probably know, European Neolithic (defined by the existence of farming and animal husbandry, and also often of pottery) began by all accounts in Thessaly, Greece (Sesklo Culture). It's characterized by a pottery painted using mostly the colors red and white and with those colors it spread through the Balcans.

More intriguing are the origins of the Cardium-Imprinted Pottery culture, specific of the Western Balcans, who did not use color in their pottery and instead decorated them with patterned impressions often made with the shell of a mollusk of the genus Cardium (hence the name). Some early pottery of this kind has been found at the Thessalian site of Otzaki, along with finer pottery of Sesklo style, however it is only known as distinct culture once it became dominant in the Western Balcans.

This Balcanic duality defines the general duality of early European Neolithic because Cardium Pottery Culture would spread by the Mediterranean shores, largely by boat, while the main Balcanic Neolithic would eventually give rise to the Central European one, often known as Danubian Neolithic.

The Cardium Pottery Culture spread with some colonization but mostly by acculturation of the indigenous peoples, as is evidenced in the toolkit continuity in most sites. They were specialized in fishing and sheep/goat herding but also carried the full package of cereals and at least one legume: lentils. They built villages but also inhabited in caves. After the initial coastal expansion local expansions took place as well already under the tag of Epicardial, most importantly along the Rhone and Ebro rivers.

Meanwhile in NE Hungary (curiously the easternmost reaches of Epi-Magdalenian culture) an ill explained cultural shift happened: the Balcanic pottery style was replaced by an engraved one. It is the Eastern Lineal Pottery Culture, which had a very limited expansion on its own (mostly to Transylvania).

However a derived culture arose then in Western Hungary, Moravia and Eastern Austria: it is the Western Lineal Pottery Culture, more commonly known as Danubian Neolithic. This one had a massive spread through Central Europe reaching into Belgium and Northern France (where it shared the territory with other minor local Neolithic cultures for some time) by the West and into Moldavia by the East, where a previous local Neolithic culture was assimilated as well. It even influenced the area of Vallachia-Bulgaria at a later time, generating which was maybe the first large European state: the Karanovo VI-Gumelnita culture, older than dynastic Egypt but short-lived.

Now it seems also clear that late Danubian peoples from Northern France brought agriculture to Britain, simultaneously to Megalithic peoples from Western France.

But I'm going too fast.


The Late Neolithic

A key an often ignored region in the second Neolithic phase is SW Iberia (mostly southern Portugal). Here there was also an important cultural shift: the custom of clannic (collective) burial in megalithic tombs known as dolmens or trilithons appeared just a few centuries after the arrival of the first Neolithic influences. Dolmenic Megalithism in this area is older than anywhere else by at least a thousand years.

Only much later, c. 3800 BCE, this custom appears in Brittany and other areas of Western France. In the following centuries it would spread through all Atlantic Europe and many parts of the Western Mediterranean, as well as penetrating in parts of the late Danubian cultural area.

It has been speculated that cod fishing may have been related to this expansion, however there must be more than just a mere economic activity: Megalithism had clearly a cultural, probably religious, element to it.

Many areas of Atlantic Europe only reached Neolithic with the arrival of Megalithism or a few centuries before it.

Another key region is more obscure: Denmark and neighboring areas. Here there was an important seagoing culture known as Ertebölle, which has been claimed to be Neolithic... only to see others rejecting that claim. This is a key issue that should be clarified in order to understand the Nordic Neolithic.

Related to this issue is that of Funnelbeaker Culture (often named by its German acronym of TRBK), which is clearly Neolithic in the North and West, where it is also Megalithic but is not in the East (Mecklenburg, Northern Poland). Some had theorized that Funnelbeaker began in Denmark, derived from Ertebölle after the arrival of Eastern influences related to Pitted Ware (another allegedly hunter-gatherer culture of Neolithic times, seemingly rooted in Eastern European Neolithic), but this is contested by others who think it's derived from some northern offshoots of Danubian Neolithic.

The issue is very murky so I prefer to leave it as it is: a mere anotation of unsolved complexity.

All this sums up pretty well the essence of Neolithic in Europe (excluding the East), I believe. In order to synthesize I had to ignore many local groups, often interesting but that add little to the global picture.


Can R1b1b2a1 be Neolithic?

Many people seem to believe that, in spite of this haplogroup being most concentrated in the westernmost reaches of Europe and decaying towards the East.

The most biased ones love to oversimplify and ignore R1b1b2a1 altogether, talking instead of R1b1b2. This was the case with the recent paper by Balaresque et al. which produced the following haplotype structure, which I have duly annotated to indicate what is not R1b1b2a1 and that way unveil the truth:


Other means West-Central-North Europe
Click to expand

It is obvious that the star-like expansion of R1b1b2 happened already at the level of R1b1b2a1 and happened already in Europe: either in Central or West Europe.

It is obvious that it does not show two distinct centers of expansion nor two different waves as should be the case would it have any relation with European Neolithic spread but instead shows one and only one general expansion affecting essentially to West and Central Europe without any kind of pattern, at least not one that we can easily spot (thank Balaresque for that lousiness).

It is obvious that the center of expansion is not in the Balcans either.

The R1b1b2a1 star-like structure has 15 basal branches, of which at least half show a clear strong presence in Iberia (sample that does not include Basques, as the only Basque sample used by Balaresque was from the North and hence included along all French in the Other category). This alone would suggest that the origin of the expansion should not have been too far from Iberia.

Oddly enough, this graph clearly supports the hypothesis of R1b1b2a1 having expanded with Magdalenian culture from the Franco-Cantabrian refuge in the late Upper Paleolithic.

However I do not bet all my money to this hypothesis because the limited haplotype diversity data I manage rather suggests slightly higher diversity in Central and even Northern Europe (this last only with small samples).

But I do bet all my money to the haplogroup having expanded before Neolithic. There is simply no way that the rapid expansion that star-like structure so clearly indicates could have been caused by Neolithic cultural flows. These can explain the scatter of other lineages like E1b1b1, J2b, G2a, T and even some subclades of I maybe. But that's about all.


[Note: what follows is an update, some 10 or 12 hours after the first publication]

What about Megalithism?

The only possibility for R1b1b2a1 to have expanded within Neolithic would be within the frame of Dolmenic Megalithism. This would fit reasonably well with the haplogroup's spread area, with some notable exceptions and would allow for Portugal to act as a transition zone between R1b1b2a* (that has high diversity in this country, comparable to that of Turkey or Italy) and R1b1b2a1a.

However this poses several problems:

First, while Megalithism may be associated to the origins of agriculture in some areas, it is certainly not the case in most. Second, Megalithism shows high cultural diversity and appears related to many different local cultures: it is not a monolithic phenomenon at all, what should be the case if it was essentially one of demic expansion. Third, some crucial areas do not fit well: East and Central Iberia were never Megalithic but are high in R1b1b2a1, instead North Africa was and shows very low levels of the haplogroup (these are just two examples: Central Germany, Austria and Italy also contradict the pattern). Fourth, Portugal has rather low levels of diversity for R1b1b2a1.


The mtDNA control

As mentioned, R1b1b2a1 has a marked star-like structure, meaning rapid expansion from a single center. Several European mtDNA lineages also have such structures. The most notable one is H, which is the second largest star-like structure in all the human mtDNA tree, after M, having 34 basal sublineages. Its descendant H1 also has a noticeable star-like structure with 15 basal sublineages. Less impressive but still meaningful are their ancestor HV (6 branches), their cousin V (9 branches), H3 (7 branches), H1b'f'g'k'q (5 branches), H2a (5 branches). In the U haplogroup there are also several with presence in Europe: K1a1 (9), K2a (6) and U5b3 (6). Other haplogroups important in Europe with some star-like structure are: T2 (7) and its descendant T2b (6), as well as I (5).

But only one group of those mtDNA star-like structures seems to be parallel in geography and dimensions to that of R1b1b2a1: H and its descendants.

In my opinion, H must have spread in Europe early on, probably with the colonization of the continent by our species in the early Upper Paleolithic. Only that can explain the the massive star-like structure, the high diversity in Central Europe and the known presence of this lineage in Paleolithic Portuguese and Moroccans. I also get those time frames using a control region mutation count. However there is one significant difference with R1b1b2a1: H is also found in Eastern Europe and Central Asia in large amounts, while R1b1b2a1 or R1b1b2 is not (and only R1b1b1 is in in Central Asia). This situation also happens in North Africa, where SW Europe-derived mtDNA H and V is very common (c. 25%) while Y-DNA R1b is very rare.

One possible explanation could be that there has been Y-DNA sweeps in those areas which did not affect so much to mtDNA. This could be because of Capsian Culture in North Africa (Epipaleolithic and Neolithic - Afroasiatic languages) and because of Kurgan migrations in Eastern Europe (Chalcolithic - Indoeuropean languages).

However it is still a weak point, admittedly.

So are there other options? I have flirted with the expansion of mtDNA K, which is a much recent expansion than that of H. But K only amounts to 6% of all Europeans, while R1b1b2a1 makes up more than 50% in all Western Europe. They are simply not comparable. Same for the other potential candidates mentioned above.

So at the moment I think that the expansion of R1b1b2a1 must have happened within that of mtDNA H, what implies a Paleolithic time frame.


Isn't a Paleolithic time frame too old for R1b1b2a1?

As you probably know, I strongly distrust molecular clock age estimates, favoring instead an holistic logic, inclusive of all genetic and archaeological data available.

The earliest Eurasian ancestors of R1b (F, IJK, K and MNOPS) must have been there in the time of the main Eurasian expansion. F, IJK and K surely coalesced in South Asia, while MNOPS did in SE Asia. Y-DNA P represents the only known back-migration to South Asia of this macro-haplogroup.

Y-DNA R and probably R1 as well surely coalesced in South Asia then but R1b already did in West Eurasia (either in West Asia or Italy). This R1->R1b migration must have happened within the colonization of West Eurasia by H. sapiens, which happened in the 50-40 Ka time frame by all accounts. So I presume that R1b is 50-40 Ka old.

Then R1b split into R1b1a and R1b1b, which must have existed in the Eastern Mediterranean arch (Italy-West Asia).

Then R1b1b split into a minor Central Asian haplogroup (R1b1b1) and the main West Eurasian one (R1b1b2). This one shows a clear origin in Anatolia-SW Caucasus, where it is most diverse, specially once excluded R1b1b2a1 (however notice that Italy and Portugal have similar diversity levels, what again makes me wonder about the exact role of Italy in particular on the spread of this lineage), and where the main R1b1b2a node seems to have coalesced on light of its non-R1b1b2a1 scatter.

And then R1b1b2a1 spread in a very quick expansion, not from Anatolia but from somewhere in West or Central Europe. This might have happened either in the early colonization of Europe (Aurignacian culture, c. 40 Ka ago), in the second wave of Gravettian culture (Cro-Magnon type, c. 30 Ka ago) or in the post-LGM recolonization from the Franco-Cantabrian refuge (Magdalenian culture, c. 15 Ka ago). It is really difficult to determine which wave but, if R1b1b2a1 has to correspond with mtDNA H, then the latter has to be discarded.

And that's what I can say on this matter. Really, without a time machine or accurate aDNA testing, we cannot say much more.

Sunday, March 7, 2010

Indonesian Y-DNA is mostly Paleolithic


Found
at Dienekes'.

Tatiana M. Karafet et al., Major East-West Division Underlies Y Chromosome Stratification Across Indonesia. MBE 2010. Pay per view.

While I don't have at the moment access to this surely interesting paper and hence to the likely substantial details, the abstract sounds highly interesting:

The early history of Island Southeast Asia is often characterized as the story of two major population dispersals: the initial Paleolithic colonization of Sahul ~45 thousand years ago and the much later Neolithic expansion of Austronesian-speaking farmers ~4,000 years ago. Here, in the largest survey of Indonesian Y chromosomes to date, we present evidence for multiple genetic strata that likely arose through a series of distinct migratory processes. We genotype an extensive battery of Y chromosome markers, including 85 SNPs/indels and 12 Y-STRs, in a sample of 1,917 men from 32 communities located across Indonesia. We find that the paternal gene pool is sharply subdivided between western and eastern locations, with a boundary running between the islands of Bali and Flores. Analysis of molecular variance reveals one of the highest levels of between-group variance yet reported for human Y chromosome data (e.g., ?ST = 0.47). Eastern Y chromosome haplogroups are closely related to Melanesian lineages (i.e., within the C, M and S subclades) and likely reflect the initial wave of colonization of the region, while the majority of western Y chromosomes (i.e., O-M119*, O-P203, and O-M95*) are related to haplogroups that may have entered Indonesia during the Paleolithic from mainland Asia. In addition, two novel markers (P201, P203) provide significantly enhanced phylogenetic resolution of two key haplogroups (O-M122, O-M119) that are often associated with the Austronesian expansion. This more refined picture leads us to put forward a four-phase colonization model in which Paleolithic migrations of hunter-gatherers shape the primary structure of current Indonesian Y chromosome diversity, and Neolithic incursions make only a minor impact on the paternal gene pool, despite the large cultural impact of the Austronesian expansion.

Bad news in any case for the Neolithicists, again confirmation for the Paleolithicists like myself. This in a context like SE Asia where it's been argued more than anywhere else in favor of a massive population replacement in Neolithic times (based on craniometric data mostly). It seems it was not the case after all.

I wonder how does Karafet and colleagues treat the issue of the proposed MNOPS macro-haplogroup downstream of K, or if just limit themselves to describe the sublineages (such as M, S and O) regardless of upstream affiliation.

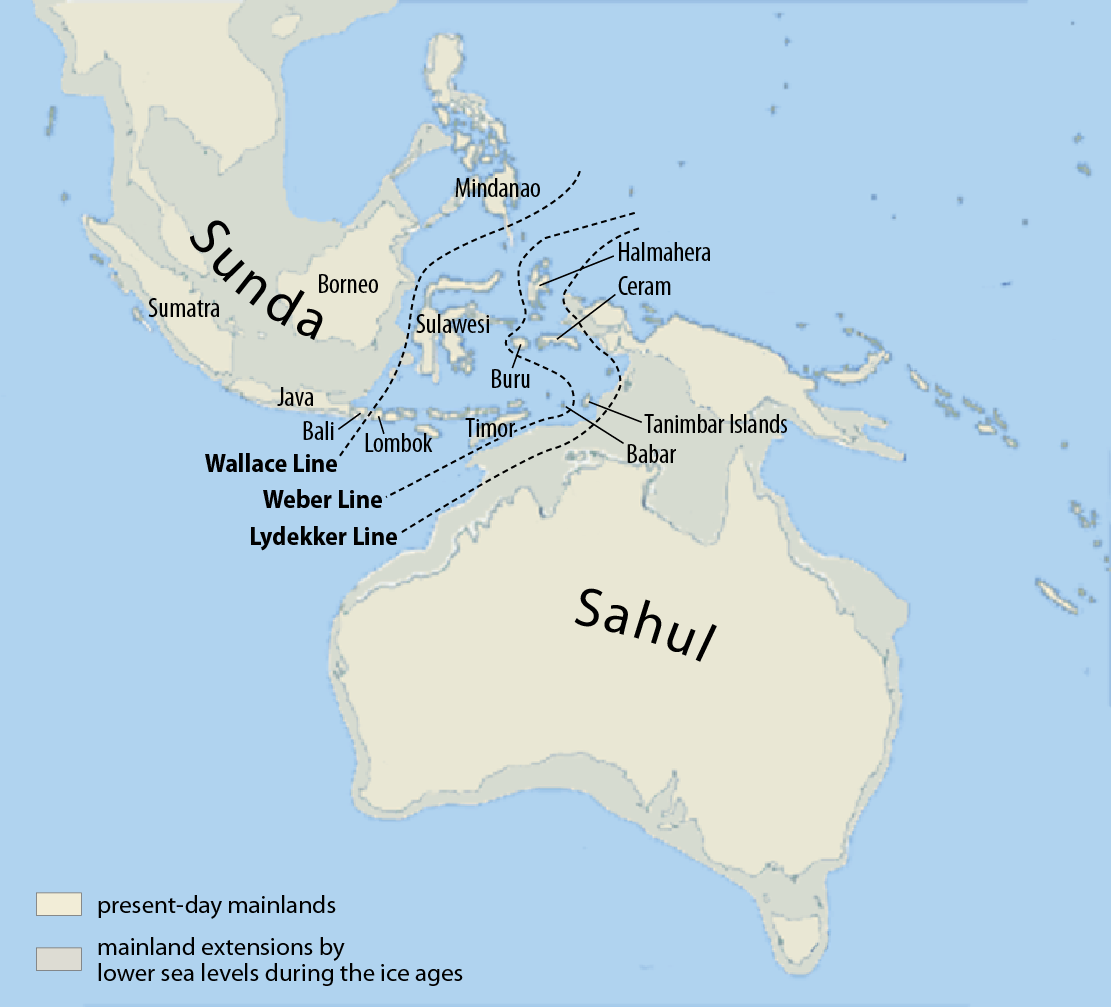
Notice that the discovered divide goes exactly along Wallace line, a major ecological divide, which exists because the continent reached in the Ice Age, when sea levels were much lower, as far East as Bali and Borneo, while the islands east of that line remained separated.


Understanding the ecological divide at Indonesia (from Wikipedia)

This divide only makes sense if navigation was limited at the time and makes no sense whatsoever if one wants to explain it within the context of Austronesian expansion, because for these formidable oceangoing sailors, who colonized as far as Hawaii, Easter Island and Madagascar, such barrier would have never been any obstacle at all.


Update (March 10):

I got a copy of the paper (thanks to Argiedude again) and the four phases proposed are as follows:
  1. Early colonization reaching to Sahul. Lineages: C*, K*, C2, M and S. Dated to c. 45 Ka ago.
  2. Second flow affecting only Sundaland. Lineages: O1a1, O2a, O3(xO3a3) and O1a. Dated to 30-15 Ka.
  3. Austronesian colonization. Lineages: O1a2 and O3a3(xO3a3b). Dated to 4-3 Ka.
  4. Late arrivals from India, West Asia and China. Lineages: H, L, J and O3a3b.

Of course, the dates attached to the two Paleolithic phases are to be taken with some caution.

Some F* (East Indonesia) and R (West Indonesia) were also detected and should be associated to phases 1 and 4 respectively.

The remnants of the first phase are found particularly in East Indonesia, Melanesia, Polynesia (as partial genetic extension of Melanesia) and Philippines, where K* still constitutes almost 50% of Y-DNA. There's also some C* and K* in West Indonesia (and notably, different source, some 25% K* among the Orang Asli of peninsular Malaysia) but it's much more patchy and diluted.

Of the second phase, I'd read that O2a and O3 are arrivals from mainland SE Asia but that O1 may have coalesced at Sundaland and flowed northwards to as far as Taiwan, where O1a2 constitutes some 90% of the Aboriginal Y-DNA, being the main haplogroup that can be directly linked to the Austronesian expansion in phase 3.

___________

Addendum (March 12): map by Argiedude showing the frequencies of the lineages belonging to the first colonization wave of Karafet, here described as "Australasian lineages" and also showing current distribution of Austronesian and Papuan languages (the latter a paraphyletic group):


_________________

Important update (Mar 14): rare H and J lineages:

Thanks to the keen eye of Ebizur and Argiedude (see the discussion here and at Dienekes' blog), two rare Y-DNA lineages have been spotted in the Karafet samples: these are H(xH1,H2) and J(xJ1,J2).

H(xH1,H2) is found in Bali (17/641 = 2.65%) along with some H1 and H2 (one case of each). This paragroup seems rare even in India.

J(xJ1,J2) is found in Bali too (2/641 = 0.3%) along with some J1 (6/641) and J2b (4/641). It is also found in Vietnam (1/70 = 1.4%), along with some J2(xJ2b) (1/70), this last one also found in Java, Sulawesi, Vanuatu and Han Chinese. J* is, according to Argiedude not really found anywhere else.

Someone by the name Finn uploaded the paper and supplements at Zoho Viewer and you can (at least by the moment), find them at these links: main, PDF supp, XLS supp.

_____________

Update July 3: Natsuya has got some further details via private communication with Tatiana Karafet. Specifically the distribution of haplogroups among the four different Han samples and STR haplotype sequences for O3b3b-M7. LINK.


Thursday, February 18, 2010

Full Khoi-San genomes published


Found via
Science Daily.

Stephan C. Schuster, Web Miller et al., Complete Khoisan and Bantu genomes from southern Africa. Nature 2010. Open access.

Four Khoi-San elders and archbishop Desmond Tutu (representing the rest of humankind and in particular South African Bantus) were scanned for their full genomes in order to overcome the limitations of the HapMap samples. The fact that any two Khoi-San are more different among them than any two Eurasians underlines the great importance of this extension to the human genetic database.

Most of the interesting details are available at the supplementary material (PDF). Among them, what most called my attention was the age estimates for mitochondrial DNA lineages (table 5).

They use a calibration point at the MRCA of H. sapiens and H. neanderthalensis, which is estimated at 660 Ka ago, with CI of 520-800 Ka (following Green 2008), however Noonan 2006 had an older estimate of 706 Ka ago (CI: 468-1015 Ka) and I have good archaeological reasons to consider an age of c. 900 Ka ago.

Hence I will review here Schuster's and Miller's median estimates but also emphasize the oldest CI dates, which I believe are closer to reality:

The Human MRCA ("mitochondrial Eve") is now dated to 205 Ka ago (or 296 Ka with the oldest CI, whch I think is best).

For the particular mtDNA lineages, the dates are:
  • L0 159 (232) Ka
  • L0d 107 (170) Ka
  • L0a'b'f'k 148 Ka (no CI)
  • L0k 79 (122) Ka
  • L0a'b'f 119 (176) Ka
  • L0f 94 (140) Ka
  • L0a 61 (95) Ka
  • L1''6 173 (250) Ka
  • L3 96 (137) Ka
Dates in parenthesis are all oldest CIs, which I fear could still be slightly younger than archaeological realism demands.

The latter date, L3, is particularly important because it signals the beginning of the Out of Africa episode. A date of c. 137 Ka ago (or even older) would be roughly coincident with the colonization of some of Palestine by H. sapiens (Skhul, Qafzeh) and could be speaking of such an old migrational event, maybe ratified by some unclear elements in the archaeology of India (see also Petraglia 2007), China and Japan (and also Crete maybe but this one without continuity).

Macrolithic Epipaleolithic in NE Iberia


I have just found about a very interesting and intriguing phase of the Epipaleolithic in the NE Iberian peninsula, which I did not know about before. Thanks to
Millán Mozota for the reference.

It seems that what used to be thought as a facies of Mousterian, defined by the saw-like edges of the tools, was eventually dated with radiocarbon to a very narrow period of the Epipaleolithic, between 10 and 8 thousand years ago.

The following papers (all in Spanish) deal with the issue:

A. Alday Ruiz, El Mesolítico de muescas y denticulados en la Cuenca del Ebro y el litoral Mediterráneo peninsular: síntesis de los datos. 2006.

Carlos Mazo Pérez et al., El Epipaleolítico macrolítico en Aragón en el contexto del valle del Ebro y la Cataluña costera. 2006.

Manuel Vaquero Rodríguez, El Mesolítico de Facies Macrolítica en el centro y sur de Cataluña. 2006.

All these articles, as well as others, are gathered in a book.

This map (from Mazo's paper, dates in thousand years ago) explains a bit how it happened:


Group 1: the macrolithic industries close the ocupation of the site after a period of abandonment

Group 2: the macrolithic industries are intercalated between early Epipaleolithic levels (Azilian/Sauveterrian) and late Epipaleolithic levels with geometrics of Cocina style (Tardenoisian of Iberian facies).

Group 3: the macrolithic industries initiate the occupation of the site, continued later with geometrics of Cocina style.

This other graph, from Vaquero's article illustrates the chronology in Catalonia:

Above: dated levels by millennium (in Roman numbers, often used in Spanish for ordinals). Below total of dates by millennium. The patterns indicate: Upper Paleolithic Magdalenian industries (black), Early "Sauveterroid" Epipaleolithic industries (horizontal stripes) and Macrolithic Epipaleolithic industries (vertical stripes).

I won't extend much on the matter as of now, as I'm still learning about it. But I find important the fact that this strange industry, allegedly related to a temporary and dramatic increase of the forests (Alday), seems to indicate the end of the so-called Microlaminar Epipaleolithic (Azilian/Sauveterrean) and precedes the establishment of the Geometric Epipaleolithic (Tardenoisian-derived).

As I have mentioned recently this last industry, though widespread, did not achieve full implantation in all the Iberian peninsula. It seems almost non-existent in Ronda (Andalusia) and as far as I know also in Murcia, where the Neolithic transition happened with the oldest Epipaleolithic facies (Microlaminar) still in use.

Instead in all this North/NE area, the Neolithic transition happens in a context of Geometric industries, also older than Neolithic itself but more recently arrived from France than the Microlaminar industries.

I wonder therefore if the Y-DNA lineage R1b1b2a1a2 (of which three subclades are found in the area described here, the others present in mainland Europe and Ireland, but very rare in West or South Iberia) may be related to the Tardenoisian spread, with the other major sublcade of R1b1b2a1, R1b1b2a1a1, being maybe related to Maglemosean and related epi-Magdalenian industries of the North Sea basin. It would make good sense if one accepts that R1b1b2a1 as a whole spread with Magdalenian culture.

Thursday, February 11, 2010

Eurasian Y-DNA note


Just a brief working note on my current understanding of Eurasian Y-DNA diffusion and diversification patterns after the out of Africa migration.


I am assuming here that the newly proposed Y-DNA macro-haplogroup MNOPS (downstream of K) is for real and that it includes (for parsimony reasons) haplogroups K2, K3, K4, M, NO, P and S. This is not sure at all but is a quite reasonable possibility.


I used color codes for the main lineages (blue for DE, orange for C and red for F). The pink line represents the main route of the Eurasian migration, the red arrows represent the main flows of F and K derived lineages, which are the most complex ones. The light red dotted ellipse represents the most likely urheimat of F, IJK and K, as well as other derived lineages such as H and P. For simplicity reasons I have not depicted the expansions of C and D, nor of P and NO.

In order to infer the possible homelands of each of the lineages I used common sense, of course, but specially I used the following method: halfway point between the centroid of the lineage and the estimated homeland of upstream clades, when no centroid was available, midpoints between downstream centroids were used. It's notable that Northwest South Asia seems to be the homeland of the most important Eurasian Y-DNA lineages, not just of F but of several major nodes downstream of it (H, IJK, L, K, P, R), however the MNOPS "boomerang" migration, if confirmed, also has its own significance - and not just for Eastern Asia and Oceania. I wonder if this peculiar Y-DNA flow into SE Asia and back into South Asia is related with the flows of mtDNA N and R.

Saturday, January 23, 2010

R1b1b2 and R1b1b2a1 distinct STR diversity


I'm borrowing here the work of
Aargiedude (again) because it's such a priceless addition that it really deserves to be paid some attention. If professional geneticists would be half as serious as this amateur, we'd know a lot more and a lot better about our the population history of humankind by now.

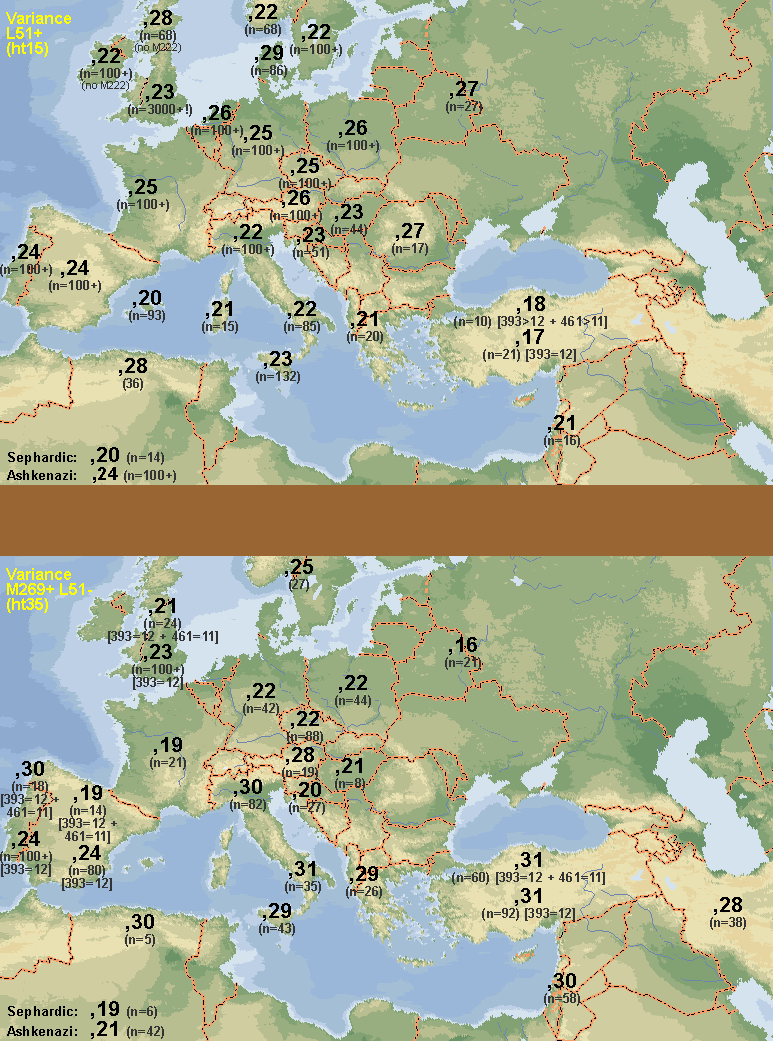
These two maps represent the haplotype diversity of R1b1b2a1 (ht15) and R1b1b2* (ht35) respectively:

Click to expand

Aargiedude's own observations at Dienekes' blog follow:

I've finished estimating ht15 and ht35 diversity, it's taken me 2 days to do this, and I think the results are amazing. The diversity clines of ht15 and ht35 are almost polar opposites. I think these results seriously call into question the conclusion of the Balaresque study, which is what prompted me to look into this. There's no surfing-on-an-expanding-wave phenomenon occuring with ht15. It has its lowest variance in the supposed origination point: Anatolia.

Instead, as Maju pointed out brilliantly, the study's tree diagram of their R1b1b2 haplotypes seems the result of 2 separate events, not a single wave diffusion. And he was absolutely right.

The diversity of ht35 doesn't form a gradually decreasing cline. It seems to be uniformly similar from Iran to west Iberia, or at least up to Italy, because there are issues with the validity of the North African and Iberian data (small sample size in one case and confusion with ht15 samples, in the other). Its cline seems to be more north-south than diagonally from southwest to northeast. East European countries have the same ht35 diversity as West Europe, with the special consideration of the west Iberian results.

Some technical details to keep in mind. Ht15 can be differentiated from ht35 by barely 2 markers: 393 and 461. Few studies test 461, so most of the samples I used were chosen on the basis of 393 alone. But about 3% of ht15 and 10% of ht35 have the "wrong" value, becoming confused with the other group. This usually doesn't matter, exceot in countries where there is an overwhelming ratio difference between the frequencies of both groups, such as in Iberia, France, Britain, Netherlands, Anatolia, and the Levant. In these extreme cases, I've included, where possible, 2 pair of results. The top pair uses samples predicted as narrowly as possible, by using both 393 and 461. The bottom pair is the standard prediction using just 393. The top pair should be more accurate, but they tend to lack in sample size, so then again, maybe not. Notice in the case of Iberia, that the less restrictive result changes drastically from the more restrictive result, and results in identical values to Iberia's ht15 diversity estimate, suggesting most of the samples are in fact ht15 samples that are being confused for ht35 because they had a mutation in 393 to the modal value of ht35 on that marker. Curiously, this didn't happen in France, where I was only able to use the less accurate method (393 alone), and yet the result is notably low and different from France's ht15 diversity. I'd seriously take North Africa's high ht35 result (0,30) with a military-issue teaspoon of salt, it's just 5 samples. On the other hand, it's notoriously high ht15 diversity (0,28) is pretty solid.

To recap, Baralesque and all geneticists are stuck in a time warp, they're back in 2003, thinking R1b is just R1b. What a waste, after going through all the effort of collecting and processing the samples, to not have had the sense to test for a few extra key mutations that define some major subdivisions of R1b1b2 and are well known for more than 5 years. The conclusions they reached would then have been very different.

The Balaresque paper was discussed at Leherensuge a few days ago.

Wednesday, January 20, 2010

R1b1b2a1: Neolithic or what?


I found at Dienekes the reference of a new paper on R1b1b2, focused on demonstrating (quite forcibly) that the lineage is Neolithic and not Paleolithic. Dienekes is, of course, happy that they chose to use his favorite (but rather disliked in the field) molecular clock methodology: the one based on the pedigree mutation rate, which make all haplogroups look extremely recent.

Patricia Balaresque et al. A Predominantly Neolithic Origin for European Paternal Haplogroups. PLoS Biology 2010. Open access. I'm provding a link to PubMed Central because at the time of writing this the original link remained broken.

I am not really happy: the pedigree rate can't be used for ages older than 5000 years (and all dates reported in this paper are clearly older) and, anyhow, the highly hypothetical molecular clock methodologies are anything but helpful when they become the main theme of a "research" paper.

I am not happy either because instead of using the already known SNP-based phylogeny of the haplogroup, they choose to treat the whole haplogroup as a single amorphous clade, when it is clearly structured. This isn't very helpful either.

Finally I am not happy either because they treat (again) the process of Neolithic spread in Europe as a single phenomenon, when it is in fact a complex array of various cultures, notably two different main vectors: one via the Morava-Danube and another via the Mediterranean coast. Both with origins not in Anatolia directly but in the Balcans. They ignore all these archaeological facts rather insultingly.

However for those who like to dig in the raw data, instead of just jumping to the too often biased and misleading conclusions, the paper still has some interest.

Notably I found figure 3 (haplotype structure) quite interesting. Here you have it with a crucial annotation for better understanding:

Click to expand

The crucial annotation is of course marking (with a dark red line) what is not part of R1b1b2a1, which is, as you can see a single branch of the star-like structure, but, unlike the others, is clearly not part of the fundamentally European haplogroup R1b1b2a1. Part of it is at the root of R1b1b2 and R1b1b2a but the rest of sub-branches must be derived, representing a distinct process centered in Turkey and nearby areas.

I dwelt on this matter in a previous post, so I'm not going to go all over it again here. Just for a quick reference a copy of the graph I posted then, showing major haplotypes and their relation with the various layers of the haplogroup:

Click to expand. Based on Alonso-2005.
DYS are 19-390-391-392-393.

As you can easily see most of the Turkish diversity belongs to the R1b1b2(xR1b1b2a1) part of the haplogroup structure. And sure I don't doubt that Anatolia or somewhere nearby is at the ultimate origin of R1b1b2. But there is a sharp distinction between that and what we find in Europe, which almost exclusively belongs to R1b1b2a1, a very specific sublineage.

And a sublineage that is very much ramified in a star-like structure, implying rapid demic expansion. When? That is not really the crucial issue as I see it. "Where?" should be the first question and a question that no paper has yet dealt with from the viewpoint of R1b1b2a1 on its own right.

In the past the lack of knowledge of the structure of the haplogroup may have served as excuse but not anymore. In fact any self-respecting geneticist should look at that SNP-based structure before dealing with STR-based haplotypes and take good notice of the distinctions.

And, if not, why not to include R1b1b1 (Central Asian) or even R1b1a (Italy and Africa mostly) and other R1b*? It is an arbitrary choice, poorly justified.

But, well, what do we get from this data set after we scrap off the extreme bias? For those who enjoy dealing with haplotypes in detail there is a long list in the supplementary material, which duly processed may provide very useful information.

I have not the time nor the resources to do that, so I have done something much simpler but also very informative: count the haplotypes by region as defined in figure 3 (above). Sadly France (incl. Basques), Germany, Netherlands, Denmark, England (incl. Cornwall) and Ireland are all dumped together in the category "other" ("West Europe" hereafter). Unlike the authors I do make the important distinction of what is R1b1b2a1 and what is not.

Follows the number of haplotypes by region and phylogenetic category (manual count so subject to minor error maybe):

R1b1b2(xR1b1b2a1):
  • Turkey: 37
  • West Europe: 20
  • Iberia: 8
  • Balcans: 2
  • Italy: none
R1b1b2a1:
  • West Europe: 198
  • Iberia: 90
  • Turkey: 13
  • Italy: 11
  • Balcans: 6
What does this say? That even between perfectly comparable regions such as Turkey, Italy and Iberia, the highest diversity for R1b1b2a1 is in the West. If you look again at figure 3 you'll notice that most Turkish haplotypes of this clade are derived from European ones, what implies back-migration after the formation and spread of R1b1b2a1, which must have happened in Western or Central Europe.

When did this happen? I am not sure but I have some things clear:

The structure of R1b1b2 does not correspond at all with what one would expect from a demic spread from the Balcans (not Anatolia directly) through two clearly distinct pathways, one to the Danube and Central Europe and the other through Italy to SE France and Iberia. Neither the Balcans nor Italy look particularly central nor we see two differentiated founder effects but only one.

Also the distribution of R1b1b2a1 in a cline that is, as the authors of this paper shamelessly admit, totally the inverse of what one could expect of a demic spread from SE Europe.

The structure of R1b1b2a1 in fact strongly suggests a spread from somewhere in the region described as "Other" and or Iberia, i.e. in Magdalenian Europe. This is in full agreement with the generally accepted theory that R1b1b2a1 spread from the Franco Cantabrian region after the Last Glacial Maximum, along with Magdalenian culture. It could have other explanations (Epipaleolithic flows, older Upper Paleolithic cultural dispersals like Gravettian or Aurignacian) but it just cannot fit within a Neolithic frame. No way!

How did it back-migrate to Anatolia? Possibly with the people who carried the rock art fashion to southern Turkey (Beldibi), which may have an offshoot also at Egypt, where some R1b1b2 is also found, as well as related haplogroup R1b1a. The exact process is still somewhat uncertain anyhow.

Sadly enough the authors have missed an opportunity to analyze the regional structure of this haplogroup in Europe. Hopefully someone else will eventually do it, helping to clarify the matter. The raw data is anyhow there for whoever wants to do it.


Update: a much more realistic geographic analysis of the diversity at the two different phylogenetic levels (by Aargiedude) can be found at this new post.

Thursday, January 14, 2010

R1b1 origin: Italy or West Asia?


One thing I have been chewing on
since I read the recent Cruciani paper on R1b1a-V88 is that, at least in that study, the region where R1b1-P25 has highest basal diversity (by haplogroups) are Italy and West Asia. Both regions have R1b1a, R1b1b and some other R1b1* (3/1173=0.25% in Italy and 1/328=0.3% in West Asia).

Another R1b1* was observed in the East Asian sample but this region lacks R1b1a.

The Italian R1b1* seems to belong (by haplotype) to two different subclades, what makes Italy provisionally a good candidate for the origin of R1b1. However notice that the Italian sample is much larger than the West Asian one, almost in direct proportion to the number of R1b1* individuals found.


Italy (incl. Corsica and Sardinia) also has high R1b1a diversity (by subhaplogroups: 2/4 basal sublineages, but lacks R1b1a*). This would suggest that the origin of R1b1a actually lays towards Africa, where basal diversity seems somewhat higher.

Of course it's a very tricky issue. Take with a grain of salt.

Tuesday, January 12, 2010

African R1b is distinct single haplogroup


I missed the relevant post at Dienekes and I'm not subscribed to the relevant magazine. Hence I'm posting on this matter somewhat late.

Whatever the case, a new subhaplogroup of Y-DNA R1b has been finally defined including all or most of African R1b1*. The defining SNP has been named V88. This lineage is found specially at the Nile area (more common in Sudan than Egypt and more in Upper Egypt than Lower Egypt) and in the Chad basin (Chadic speakers).

The authors conjecture an age of 9200-5600 BP for the haplogroup but I'd say that it should be rather from c. 16,000 BP, when rock art in the style of Europe and Anatolia (other regions high in R1b) is found in Upper Egypt. As always, molecular clock age estimates should be taken with extreme caution if not total disregard: it's much closer to pseudoscientific speculation than to empirical science.

Fluvio Cruciani et al. Human Y chromosome haplogroup R-V88: a paternal genetic record of early mid Holocene trans-Saharan connections and the spread of Chadic languages. European Journal of Human Genetics 2010. Behind a paywall.

___________

Update (Jan 13):

I finally put my hands on the paper (thanks to Vincent) and is quite curious. Anyhow it is worth mentioning first of all that the new phylogeny has already been added to ISOGG.

Second, it is also worth mentioning that this paper does not deal with Sudanese R1b1*, which is probably part of the new haplogroup but still awaiting confirmation.

Third, it is most interesting that, while the new R1b1a (V88) is most frequent in Central Africa (and secondarily North Africa, specially among Siwa Berbers, Egypt), two out of four basal sublineages are exclusively found in Southern Europe.

In detail:

  • R1b1a* (V88) is common in Central Africa (0-95.5% depending on the ethnicity), with some presence in North Africa (0-23.7%, this last among Siwa Berbers) and also found in West Asia and the Balcans at very low levels (0.3 and 0.2% respectively of regional composite samples).
  • R1b1a1 (M18), formerly R1b1a, is located in Corsica (0.7%), though is also known (older materials) to exist in Sardinia at high frequencies and, if my memory is correct, SE France as well.
  • R1b1a2 (V8) is a private lineage found only in one Tali individual (4.5%, n=22). The Tali are a Niger-Congo (Adamawa) speaking population of North Cameroon that also shows 9.1% (two individuals) with R1b1a*.
  • R1b1a3 (V35) is a very small lineage restricted to Italy (two individuals, one belonging to sublineage R1b1a3a-V7), where some R1b1* (P25) was also observed (3/1173).
  • R1b1a4 (V69) makes up the largest subhaplogroup of R1b1a and is found with about the same distribution as R1b1a*, that is in Central (0-62.5%) and North Africa (0-4.9%).
Conclusions? Few and cautious. The haplogroup shows a striking distribution in two branches: one in Africa (R1b1a* and R1b1a4 primarily) and the other in southern Europe (R1b1a* at very low levels with R1b1a1 as main subclade almost circumscribed to Sardinia). Based on its European distribution, apparently unrelated to Africa, it should have a timeline dating to at least Neolithic times. It might be older in Africa (see above), though I'd be willing to consider a Neolithic timescale if a consistent archaeological pattern is provided as support. A Nile area origin is very likely for this continent (but see the haplotype structure, with Central African R1b1a* at the very center - yet looks as an artifact because of the many lateral branches leading to R1b1* and other control subclades).

______________________________


Adendum (Jan 15):

Ebizur has posted some nice complementary information for this lineage, specifically the M18 subclade, in the comments section. I find it so informative that I can't but copy here:

Haplogroup R1b1a1-M18 has previously been observed in Sardinia and Lebanon.

Peter A. Underhill, Peidong Shen, Alice A. Lin et al. (2000), "Y chromosome sequence variation and the history of human populations," Nature Genetics, Volume 26:

Sardinia
1/22 = 4.5% Haplotype 2(=A3b2-M13/M63/M127)

1/22 = 4.5% Haplotype 32(=E1b1b1c1-M34(xE1b1b1c1a1-M136))
4/22 = 18.2% Haplotype 35(=E1b1b1a-M78(xE1b1b1a3a-M148))

11/22 = 50.0% Haplotype 50(=I2a1-M26(xI2a1a-M161))
1/22 = 4.5% Haplotype 56(=J2a4b-M67(xJ2a4b1-M92, J2a4b2-M163/M166))
2/22 = 9.1% Haplotype 71(=F-M89(xH(1?)-M52/M69, I-M170, J2-M172, K-M9, M62))

2/22 = 9.1% Haplotype 100(=R1b1a1-M18)

Daniela Contu, Laura Morelli, Federico Santoni et al., "Y-Chromosome Based Evidence for Pre-Neolithic Origin of the Genetically Homogeneous but Diverse Sardinian Population: Inference for Association Scans," PLoS ONE, Issue 1, January 2008:

Cagliari (southern Sardinia)
3/187 = 1.6% R1b1a1-M18

Sorgono (central Sardinia)
5/103 = 4.9% R1b1a1-M18

Tempio (northern Sardinia)
0/86 = 0.0% R1b1a1-M18

Pierre A. Zalloua, Yali Xue, Jade Khalife et al., "Y-Chromosomal Diversity in Lebanon Is Structured by Recent Historical Events," American Journal of Human Genetics 82, 873–882, April 2008:

Lebanon
5/914 = 0.55% R1b1a1-M18
(seems to have been found in 3/104 = 2.9% Lebanon Druze, 2/432 = 0.46% Lebanon non-Druze Muslim, and 0/378 = 0.0% Lebanon Christian).

Anyway, according to presently available data, the maximum frequency of R1b1a1-M18 is found in the same population in which the maximum frequency of haplogroup I2a1-M26 is found: that of the central highlands (i.e. the so-called "Barbagia") of Sardinia. Barbagia is one of the most sparsely populated areas in Europe.

Update: I uploaded the paper HERE.